A/B Testing for marketing campaign selection
t-test to determine the best of 3 marketing campaigns
A/B testing is one of the most common practices followed in data-driven organisations. It can be used to tweak product features, optimise ad campaigns, improve checkout experiences in e-commerce stores and in many other use cases. In fact, it is seen as a go-to, tried-and-tested approach based on trust and evidence for making decisions today, unlike the older way of being based on HiPPO (Highest Paid Person’s Opinion) . It is also a data science task that brings together domain knowledge, expertise in statistics and experimentation and communication skills. In this project, I explore the marketing campaign data from a company that is launching a new product and use A/B testing to determine which among 3 variants of a campaign yields the best results.
Data set
The data used here is from 3 marketing campaigns that were tested for 4 weeks at different stores and in different markets, with the weekly sales generated recorded. The goal was to figure out which campaign delivered the best result on sales and therefore can be continued.
The data collected included:
- MarketID: The ID of the market/store
- MarketSize: A categorisation of how big the market size was - small, medium or large
- LocationID: Another ID to note the location of the store
- AgeOfStore: How long the store has been in operation
- Promotion: The campaign that was tested at the store (1 to 3)
- week: The week of the test (1 to 4)
- SalesInThousands: Sales generated in thousands for that specific market, location, week and using that promotion.
There are 548 observations and 7 variables in the dataset, with no null values. Not every observation has a unique value, as shown below:
No. of unique values for MarketID: 10 No. of unique values for MarketSize: 3 No. of unique values for LocationID: 137 No. of unique values for AgeOfStore: 25 No. of unique values for Promotion: 3 No. of unique values for week: 4 No. of unique values for SalesInThousands: 517
This shows that the campaigns were shown to 137 stores in 10 markets, of varying sizes.
Data exploration
Before doing the A/B testing, the data needs to be explored to ensure that the 3 campaigns are somewhat equally distributed across the other key attributes. This is so that we can be certain that the results, i.e, sales generated are primarily due to the campaigns and not due to an asymmetry in the other attributes.
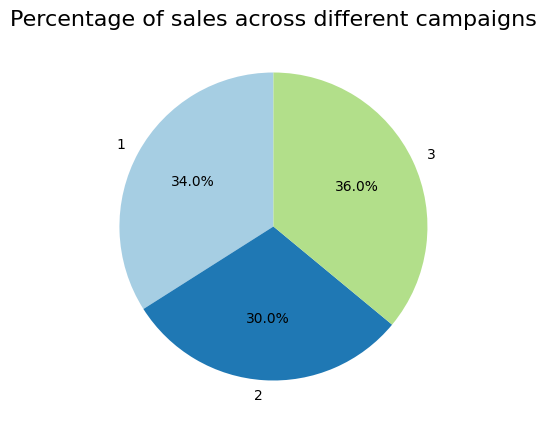
Exploring how the sales generated is distributed across the 3 campaigns, it can be seen that all 3 campaigns contribute to the sales roughly equally although Promotion group 3 results in largest sales amount.

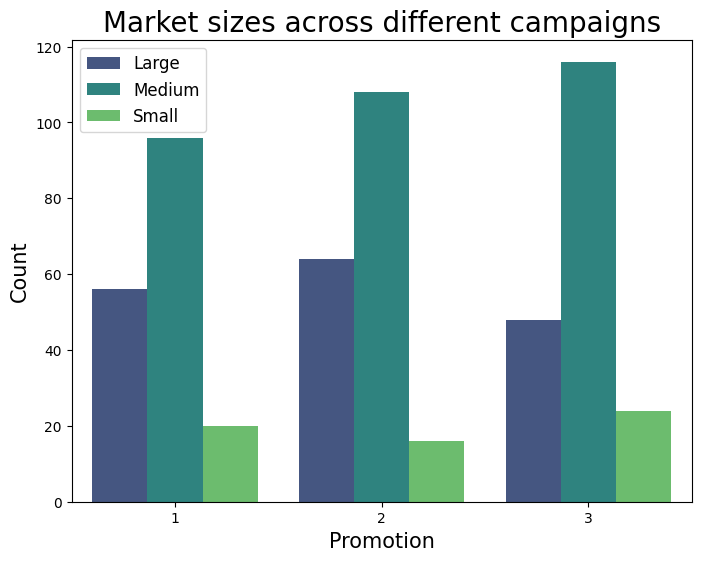
Similarly, exploring the market sizes reveals that all 3 campaigns were exposed to stores with different market sizes, with the Medium sized markets leading followed by Large sized and then Small sized.

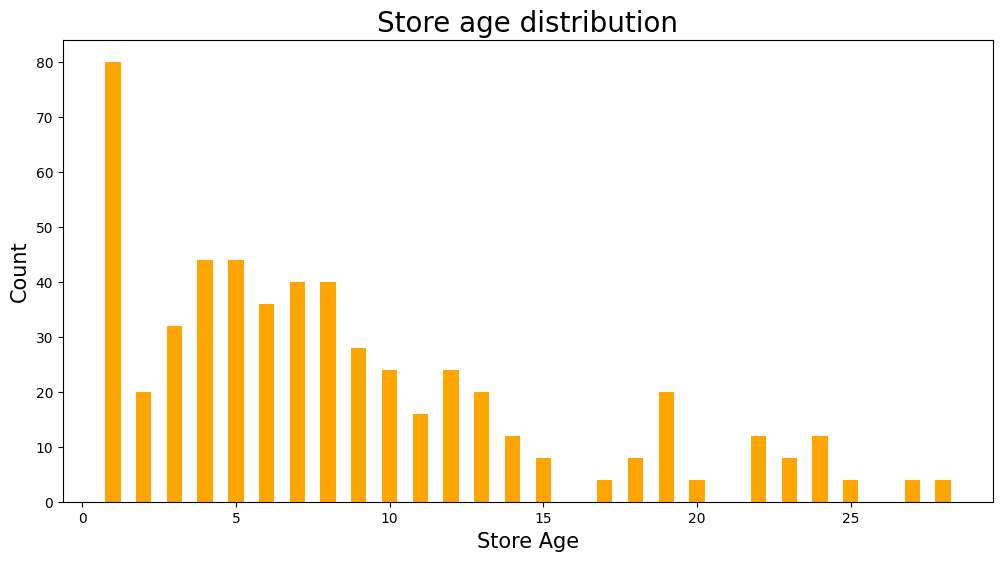
Next, looking at the age of the stores, we see that most of them are less than 10 years old, with a significant number of them being 1 year old.

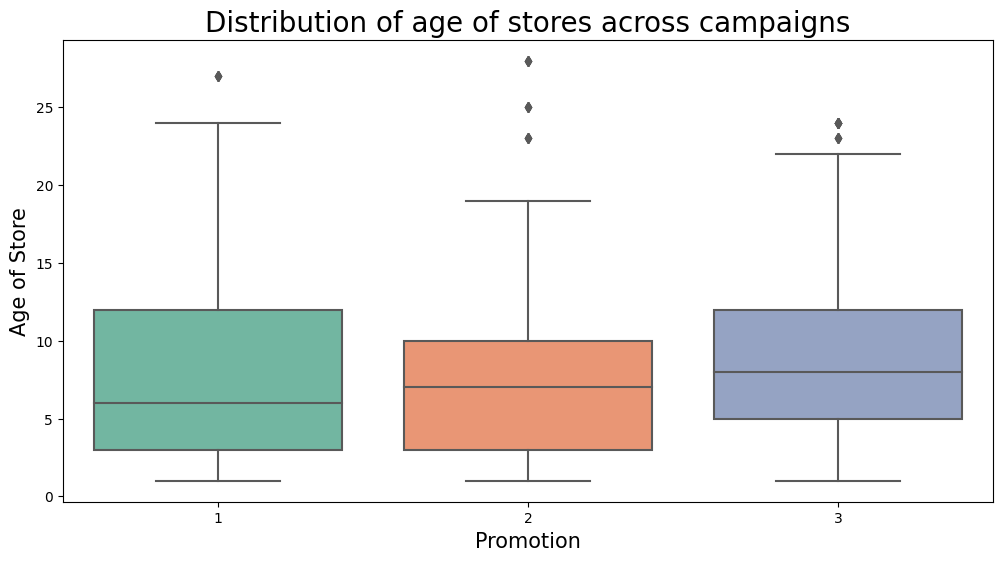
Breaking this down into individual campaigns:

We see that all 3 campaigns were exposed to a similar age profiles - with the average age of store being 8 to 9 years old.
Now that we can check that the 3 campaigns are somewhat similar, it makes sense to proceed with the statistics of A/B testing.
T-test to check for statistical significance
Next up is testing for statistically significant difference between the campaigns. What we’re looking for is a statistically significant difference in the sales generated between each of the campaigns. For this, we average the sales per campaign and use a t-test.
The t-test produces 2 important statistics - the t-value and the p-value.
- t-value measures how different the results are in relation to the variation in the data. A higher t-value means that there is more difference between the testing groups.
- p-value is the standard concept from statistics which, simply put, measures the probability of getting the observed results, or a more extreme difference between the groups, given the null hypothesis (i.e. that there is no difference between the groups). That means that the lower this p-value, the more confident we can be that the observed difference did not result by chance and that there is indeed a difference between the two campaigns.
The t-test can be done either manually, or using the ttest_ind function from the scipy.stats packge.
To calculate manually, we need the averages of the sales for each campaign, their standard deviation and number of observations.
promo_1 = data[data['Promotion'] == 1]['SalesInThousands']
promo_2 = data[data['Promotion'] == 2]['SalesInThousands']
promo_3 = data[data['Promotion'] == 3]['SalesInThousands']

mean_1 = np.mean(promo_1)
mean_2 = np.mean(promo_2)
mean_3 = np.mean(promo_3)

std_1 = np.std(promo_1, ddof=1)  # ddof=1 for sample standard deviation
std_2 = np.std(promo_2, ddof=1)
std_3 = np.std(promo_3, ddof=1)

n_1 = len(promo_1)
n_2 = len(promo_2)
n_3 = len(promo_3)

t_value = (mean_1 - mean_2) / np.sqrt((std_1**2 / n_1) + (std_2**2 / n_2))
df_1_2 = n_1 + n_2 - 2
p_value = 2 * stats.t.cdf(-abs(t_value), df=df_1_2)
print(f"t-value: {t_value}")
print(f"p_value: {p_value}")

t-value: 6.42752867090748
p_value: 4.1432972177084283e-10
t-value of 6.4275 and p-value of 4.143e-10 (less than 0.05) suggest that the null hypothesis (no difference between the 2 campaigns) can be rejected and that the difference between campaigns is significant.
t_value = (mean_1 - mean_3) / np.sqrt((std_1**2 / n_1) + (std_3**2 / n_3))
df_1_3 = n_1 + n_3 - 2
p_value = 2 * stats.t.cdf(-abs(t_value), df=df_1_3)
print(f"t-value: {t_value}")
print(f"p_value: {p_value}")


t-value: 1.5560224307758632
p_value: 0.12058631176434825
t-value of 1.5560 and the p-value of 0.1205 (greater than 0.05) shows that there is no significant difference between campaigns 1 and 3.
The same t-test can be done using the scipy.stats package.
# T-test between promo_1 and promo_2
t_test_1_2 = stats.ttest_ind(promo_1, promo_2, equal_var=False)  # Use equal_var=False if variances are assumed unequal

# T-test between promo_1 and promo_3
t_test_1_3 = stats.ttest_ind(promo_1, promo_3, equal_var=False)

# Printing the t-test results
print(t_test_1_2)
print(t_test_1_3)


Ttest_indResult(statistic=6.42752867090748, pvalue=4.2903687179871785e-10)
Ttest_indResult(statistic=1.5560224307758634, pvalue=0.1205914774222948)
Using the t.test from the scipy.stats package we get the same results for the comparison between campaigns 1 and 2 and campaigns 1 and 3.
Thus, campaigns 1 and 2 are better than 3 and either of those can be used for driving sales.