Quantifying climate change
Global temperature change since the Industrial Revolution
This project analyzes global temperature changes using deviations from a baseline and determines the relationship between GDP and temperature deviation via a linear model. It shows that temperatures have increased globally throughout the years with a sharper increase in the last 50 years. The relationship between global temperatures and GDP is not entirely clear.
(For a walkthrough of the code and explanation of each step, check out the long-form article at Medium .)
Tech used
- R and Quarto in RStudio
Data set
Berkeley Earth put together the data set, which compiles three of the most cited land and ocean temperature data sets: NOAA’s MLOST, NASA’s GISTEMP, and the UK’s HadCrut. It combines 1.6 billion temperature reports from 16 pre-existing archives, including Global Land and Ocean-and-Land Temperatures (GlobalTemperatures.csv), which tracks the average land and ocean temperatures from 1750 along with their uncertainties and their maximums and minimums (from 1850) until 2015. Additionally, it contains sheets that slice the data by country, state, and city.
The global_temp dataframe contains 3192 observations of 9 variables. The dates range from 1750-01-01 to 2015-12-01. So (2015-1750)*12+12 = 3192 dates (for every month). We have one unique record for every month
How have temperatures risen across the world since 1750?
There is a visible increase in the years from 1900 to 2000 and beyond, with 4-5 “bands” that most likely indicate seasons. The data from 1750 to 1850 has a bit more of noise/uncertainty. This “noise” may be the result of unstandardized data collection and multiple sources.
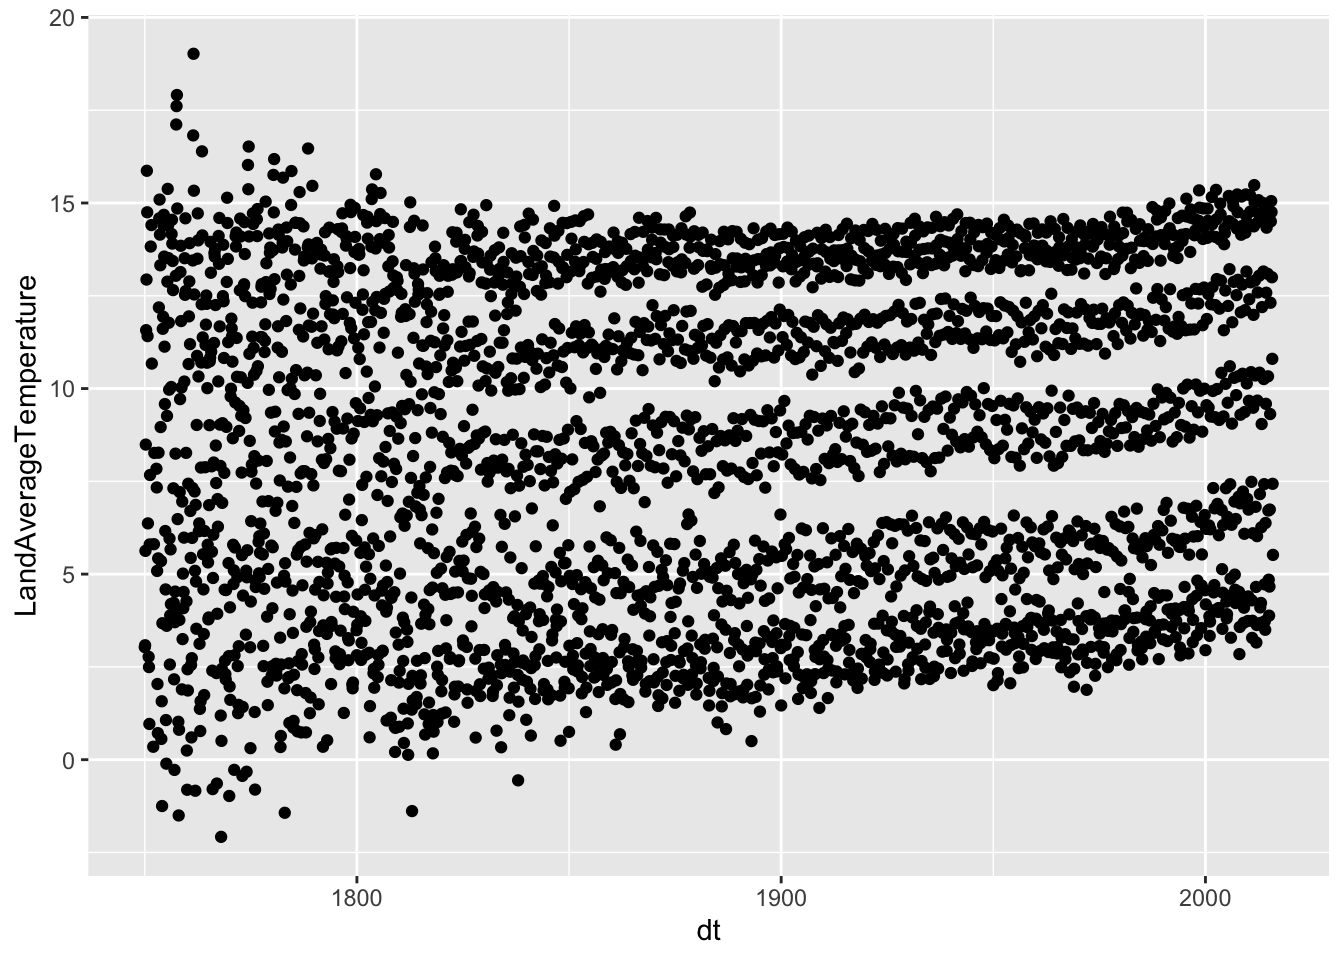
This displays the entire dataset with temperatures for every month, which fluctuate due to season in every location. We can smooth it out by breaking it down by year and decade or comparing months across the years.
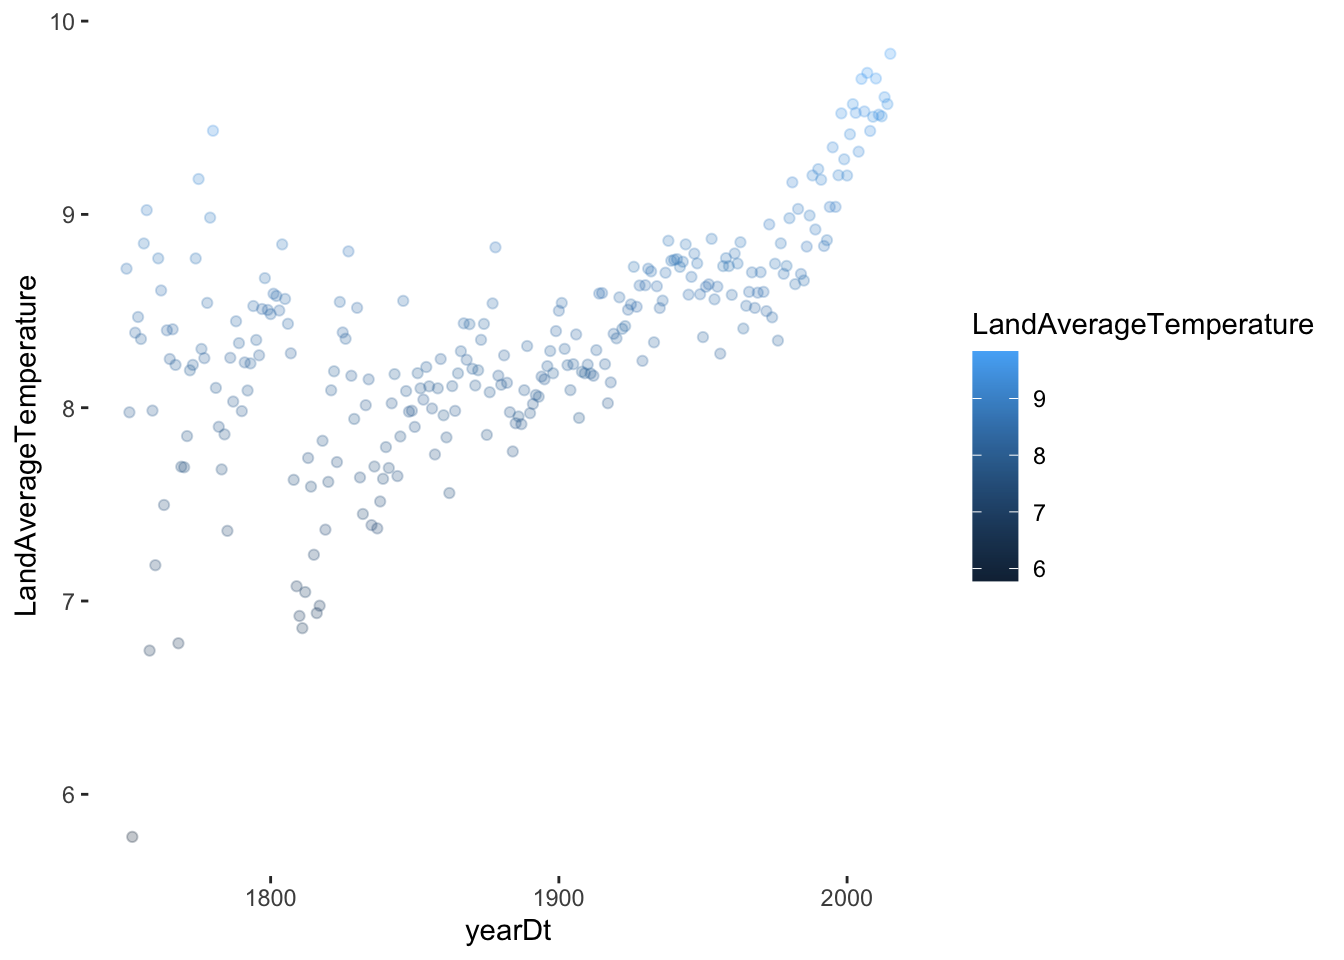
There is a clear rise in the average temperature over the last two centuries and a steep rise in the last 10-20 years. This proves our hypothesis somewhat that the sharpest increase has occurred within the last 50 years.
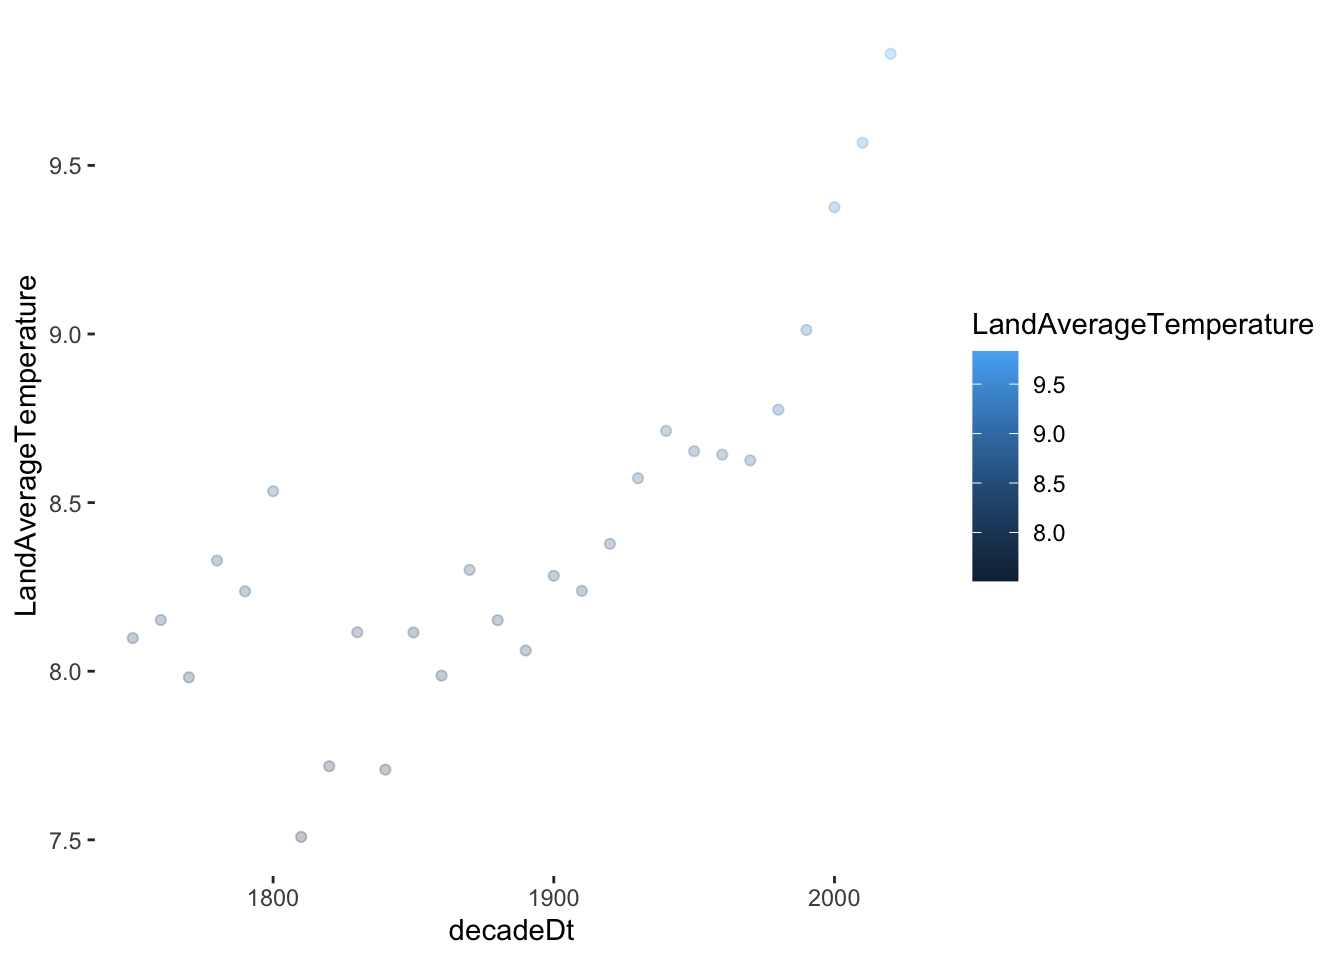
The decade distribution shows the same increase:
Quantifying the rise
It is clear that global temperatures have risen and will likely continue to do so. We want to explore precisely how much they have been increasing. For this, we need a metric to identify how far the LandAverageTemperature has deviated from a baseline that makes sense.
Climate science is a constantly evolving field; different models use different baselines, depending on the specific research question addressed, the availability of data for that time, and the ability of the model to accurately simulate climate conditions over that period. Some studies use the first 100 years of available data as a baseline. In this project, the average of the previous 100 years (1750 to 1850) was selected as an initial baseline to compare how the average temperatures have risen since 1850.
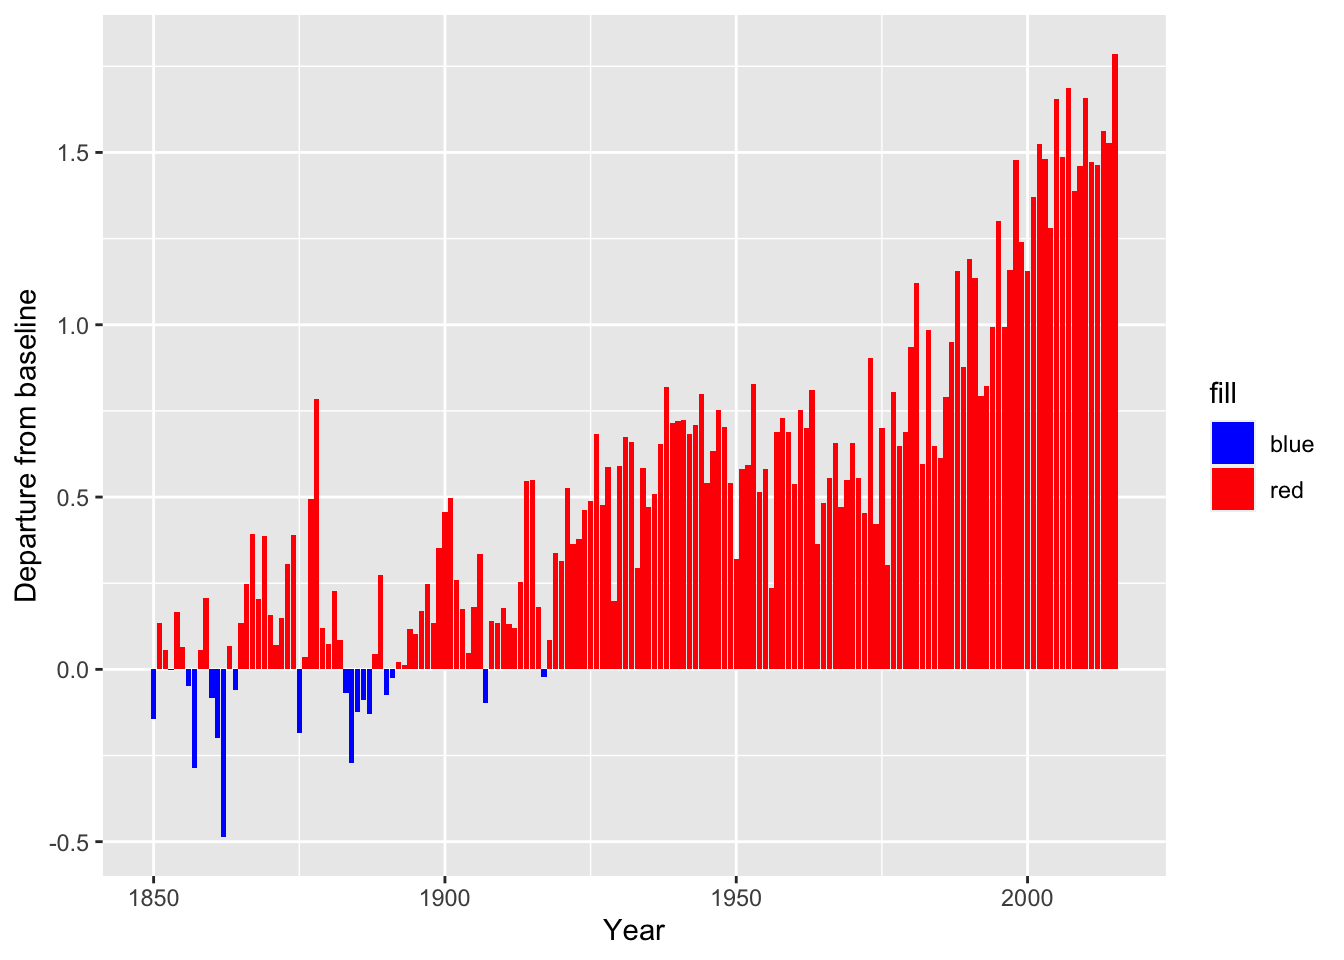
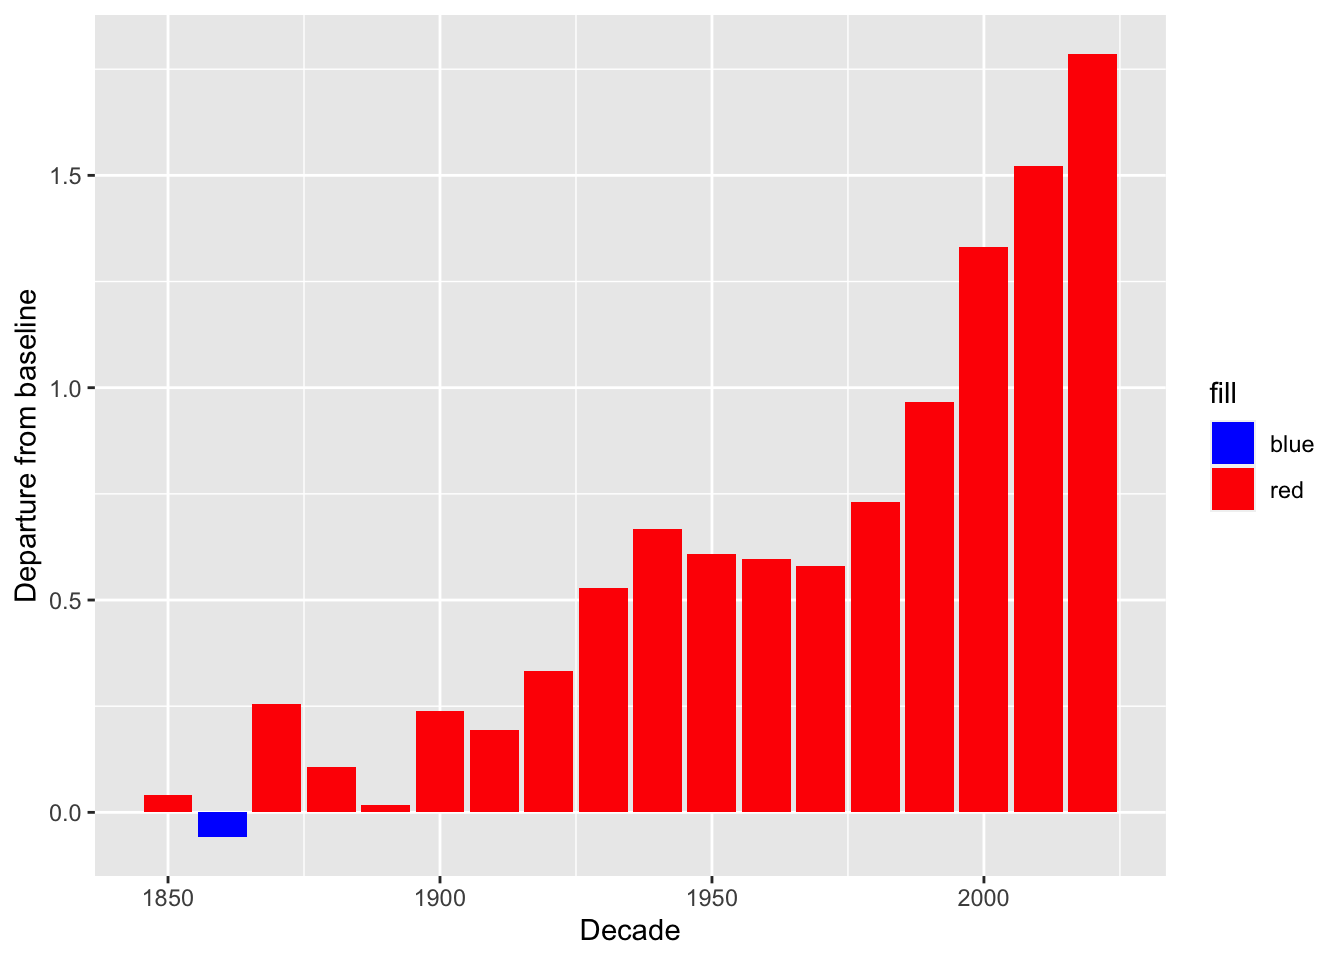
Every decade the departure from baseline (on average for that decade) has increased.
Calculating departures from the baseline for each country
We calculate the departure of each country from the global mean and explore how much each country has deviated from their own baseline since different regions have different climate characteristics (e.g. a meaningful baseline for Russia may be too cold for Qatar, or the global mean may not be a meaningful baseline for Greenland).
Calculating the departure from their own mean AverageTemperature of the baseline years (before 1850)
Country max_departure <chr> <dbl> 1 Russia 23.0 2 Mongolia 22.1 3 Kazakhstan 20.9 4 Canada 20.7 5 Greenland 19.4 6 Denmark 19.2 7 Uzbekistan 19.0 8 Turkmenistan 18.2 9 Finland 18.2 10 Estonia 17.8
How does the change in temperatures in countries relate to GDP?
I used a linear model to determine if there is any correlation between a country’s GDP and their deviation from the baseline temperature. For this, I needed to import a new dataset for GDP and clean it to be able to match our countries.
One we have a measure of GDP for each country, we need one single measure of departure to find out the relation between GDP and temperature change. For this single measure of departure, we average all departures from 1950 until the end.
Running the linear model gives us the following result:
Call:
lm(formula = avg_depart ~ country_mean, data = country_gdp)

Residuals:
     Min       1Q   Median       3Q      Max
-1.07382 -0.18463 -0.03591  0.07786  1.30632

Coefficients:
              Estimate Std. Error t value Pr(>|t|)
(Intercept)  8.820e-01  2.594e-02  34.001   <2e-16 ***
country_mean 2.965e-14  3.174e-14   0.934    0.352
---
Signif. codes:  0 '***' 0.001 '**' 0.01 '*' 0.05 '.' 0.1 ' ' 1

Residual standard error: 0.283 on 127 degrees of freedom
Multiple R-squared:  0.006822,  Adjusted R-squared:  -0.0009979
F-statistic: 0.8724 on 1 and 127 DF,  p-value: 0.3521

The results of a linear model between the departures and the GDP are not showing a clear linear relation. The coefficient OF ~ 2.9e-14 is very small suggesting that GDP is not that significant of a metric to determine the average departure of temperatures. There could be many other factors, such as HDI, that influence the extent to which temperatures deviate from the baseline. In other words, we will need a more complex model.
Final thoughts
This project corroborates what is already well-known. Global temperatures have been rising steadily because of climate change. The data shows that the sharpest increase in temperatures occurred within the last 50 years. However, the deviations in temperature are not uniform; some countries have been affected more than others. Research regarding climate change suggests that high-latitude countries are seeing more significant temperature deviations. Many factors contribute to these shifts, for example, positive feedback, which results from melting ice absorbing the sun’s warmth rather than the solid ice reflecting it. Therefore, colder countries are seeing more shifts in weather and temperature patterns.
We also attempted to determine the relationship between GDP and temperature deviations. However, the linear model did not clearly define the correlation between these two variables. The model likely lacks complexity; there are many interacting variables, each of which could affect the extent to which temperatures are affected. For example, the human development index (HDI). Nevertheless, the findings may serve as the foundation for further research.