Audience segmentation with unsupervised learning
kMeans clustering of visitors to Google Merchandise Store
Marketers generally adopt some standard segmentation and clustering techniques to identify and group customers based on their purchase behaviour. But this project explores how a similar clustering approach can be used to segment audiences at the top stage of the funnel, i.e., those that are in the awareness stage and may not have converted yet. Brands spend a lot of time and resources trying to understand their audience before they convert to a customer. Identifying the different groups or clusters of audience characteristics at this stage will help marketers device appropriate strategies, campaigns and tactics to ensure that they target those visitors with the best chance of converting and building loyalty with them further down the line.
In this project, we performed clustering of the web visitors to Google’s Merchandise Store using kMeans clustering, using their web analytics data. The clustering stage is preceded by the standard steps of data science, including cleaning, exploration, feature selectiona and preprocessing.
(For a walkthrough of the code and explanation of each step, check out the long-form article at Medium or if you want to run the code along with each step, see the Kaggle notebook .)
Tech and techniques used
- Python in Visual Studio
- kMeans clustering
Data Collection
The data used for this project are from select files used for the Google Customer Revenue Prediction Competition on Kaggle . A Kaggle user was able to extract this data into json files here which might be easier to work with.
The first dataset involves 903653 observations of visits to Google’s Merchandise Store for a period of a year between the 1st of August 2016 to 1st of August 2017.
The second is another dataset related to this same Google store data, that includes more numerical variables like Sessions, Average Session Duration, Bounce Rate, Transcations and Goal Conversion Rate. This was not part of the original Kaggle competition but it came to be as a result of a “leak” in the competition dataset which sparked some discussion in their forum after which the competition was shut down. This second dataset has been provided by a Kaggle user in corresponding csv files here . We can use this to merge into the first dataset when needed.
Data Exploration
Some observations from exploring the data:
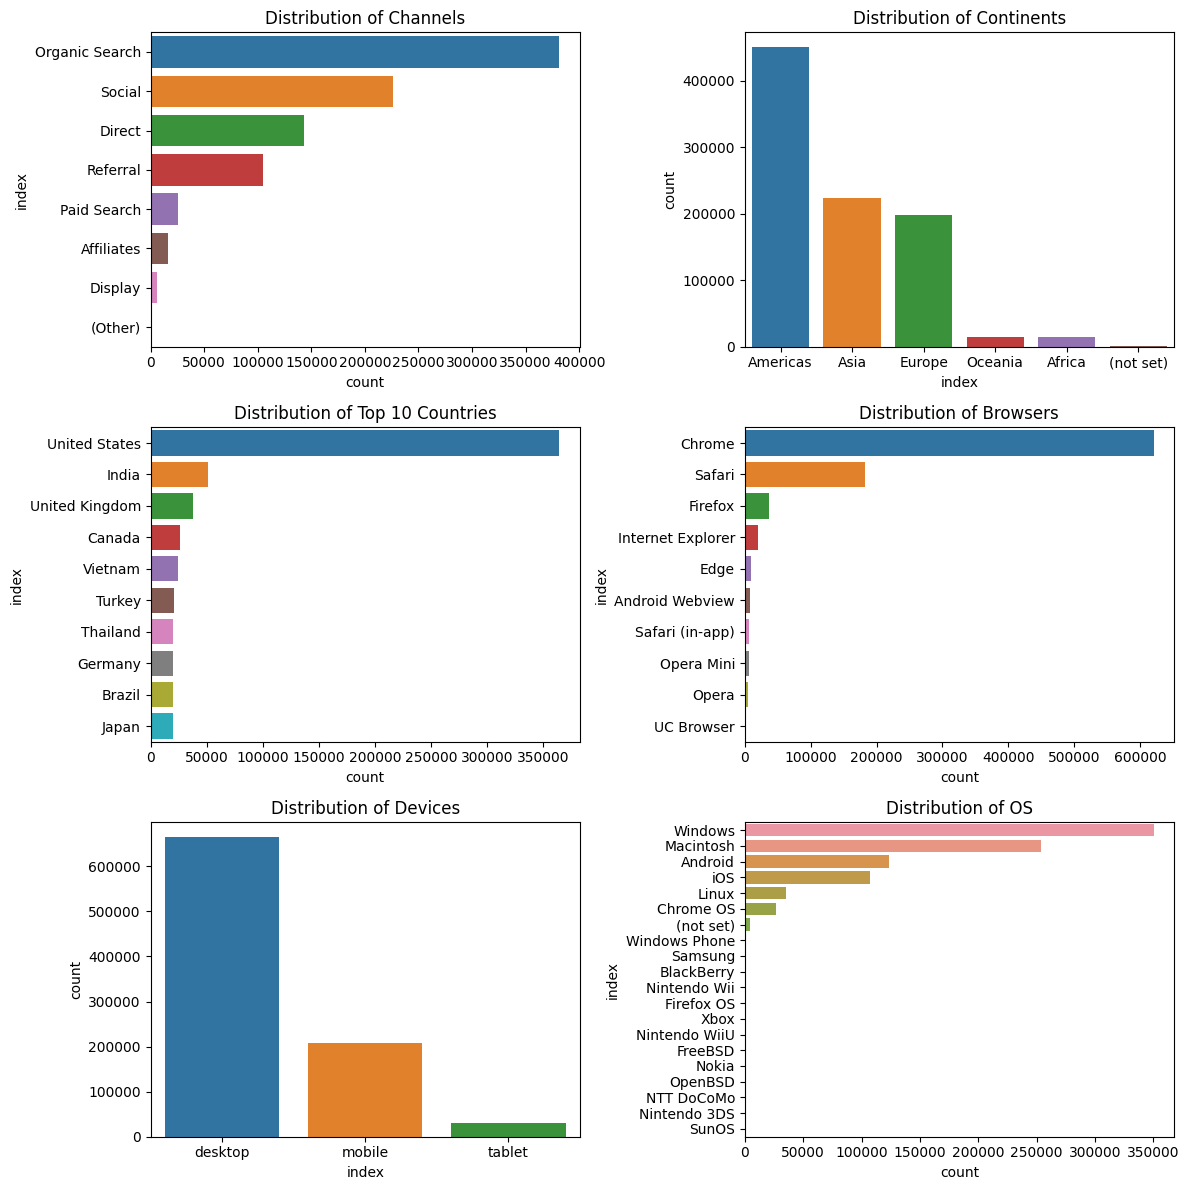
From these graphs, we can see that:
-
Channels: Google search is the most popular source of visits, followed by Social channels and Direct. Paid search and ads are not a major source.
-
Continents: The Americas receive a greater number of visits compared to any other continent, nearly twice as many as Asia and Europe combined.
-
Countries: When considering individual countries, the USA and India attract the highest number of visitors, followed by the UK.
-
Browser: Chrome is the most commonly used browser, with Safari being the second most popular choice.
-
Device: Most visitors come to the website on a desktop, but there are also a lot of visitors on mobile and a few from tablets as well
-
OS: Most visitors are Windows users, then Apple Mac users. Then comes Android users on mobile, followed by iOS users. This may just be useful to get an idea of visitors’ “lifestyle choices,” such as their preferred operating systems (for example, Mac users versus PC users).
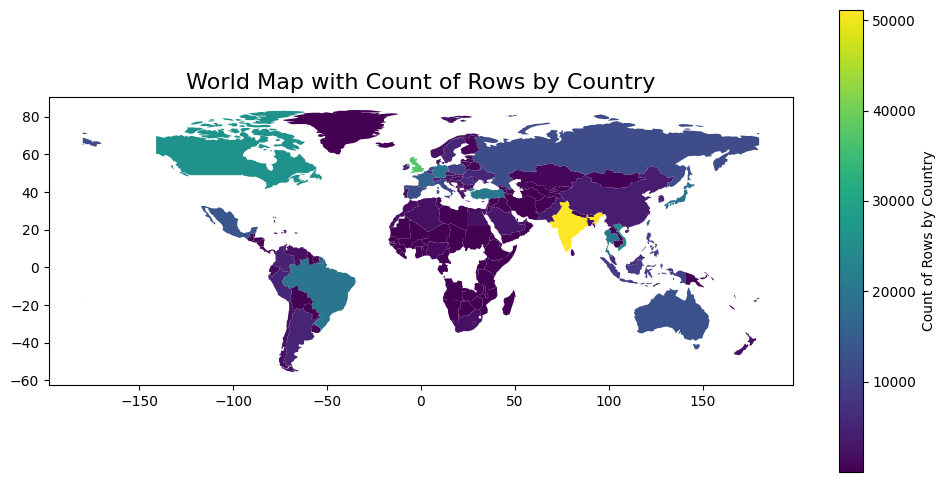
The US, India, UK, Canada and Vietnam are the top 5 countries sending traffic.
It is also useful to explore how the visits change over time, throughout the year and on a weekly basis to see if there are any patterns we can take advantage of in the eventual clustering.

As we can see here, the store experienced a higher number of visits during the period from October to January. This can be attributed to the start of the holiday season, as people engage in extensive shopping for themselves or to purchase gifts for others.
Unexpectedly, the number of visits is lower on weekends compared to weekdays.
The timeframe from approximately 11 am to 11 pm appears to be when the store receives the highest number of visitors. However, it is important to note that this observation may not provide a valuable insight due to visitors coming from different time zones. To check how different the visitStartTimes can be in different countries, we can also drill down to the distribution of visits per hour of the day for some of the top countries by visits.
Data Preprocessing
We can drop some of the features. Just to be thorough, we also check for multicollinearity to see if there are any highly correlated variables
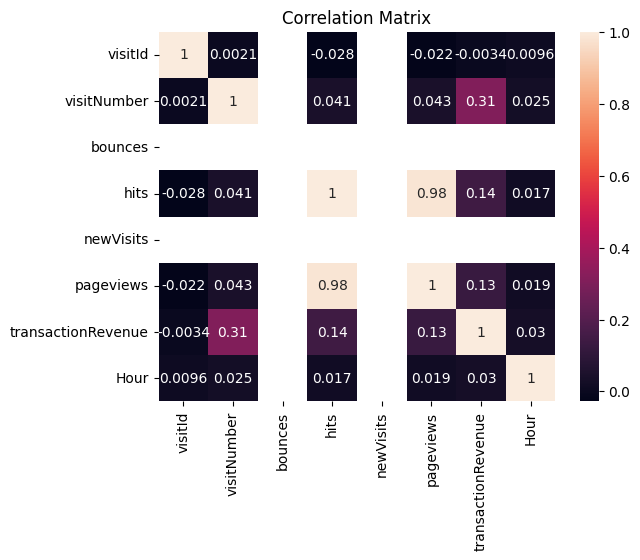
When 2 or more are highly correlated, it can cause issues with model interpretation and stability. We see that hits and pageviews are very highly correlated Bounces, newVisits and isTrueDirect are binary categorical variables so they don’t show up numbers in the above heatmap.
Clustering
Pageviews and hits are highly correlated so we have to remove one of them.
Additionally, any kind of IDs don’t mean anything for clustering or any model, so we can drop ‘sessionId’, ‘visitId’ (‘fullVisitorId’ we need to keep for clustering).
Also, since we have the device category variable, there is no need for the is device.isMobile variable as it is redundant.
And lastly, if channel is not Direct, isTrueDirect will always be false and vice versa (except for nan missing values), we can drop this too.
We first try clustering based only on the numerical variables first. So for the first clustering, we will remove all the other variables.
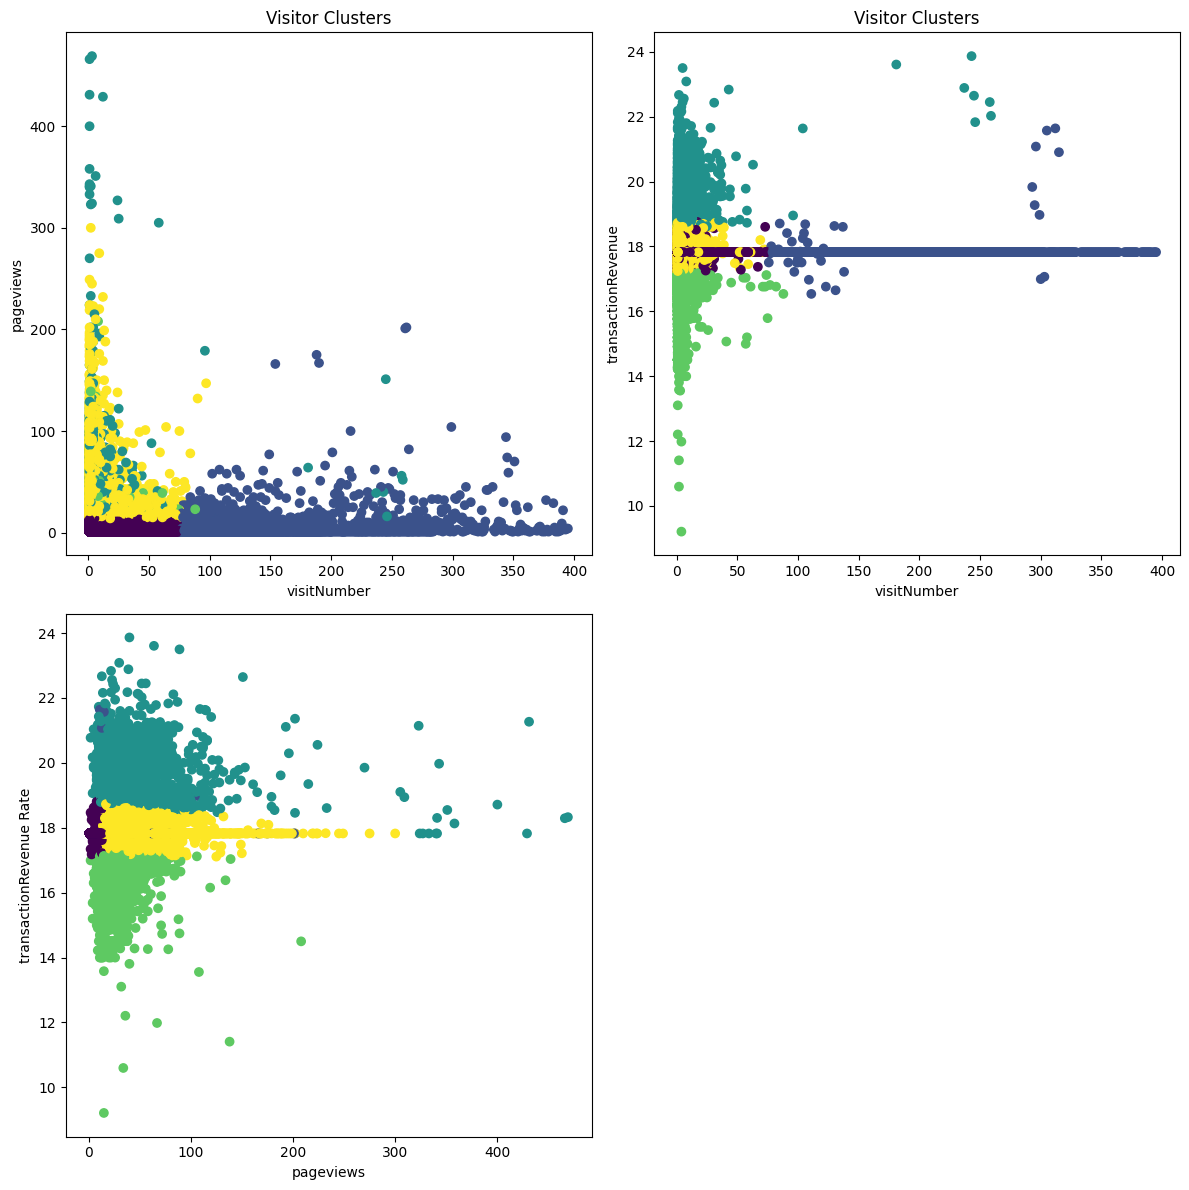
What we find is that there are approximately 4 clusters based on visitNumbers, transaction revenue and pageviews.
-
(Green): Low pageviews, lower transaction revenue, low visitNumbers
-
(Yellow): Low-medium pageviews, low visitNumbers and medium transaction revenue
-
(Dark blue): High visitNumbers, medium transactionRevenue and very few pageViews
-
(Dark green): Low to medium pageviews, High transactionRevenue, high visitNumbers
Including more numerical variables
Until now we have been only using 3 numerical variables to find clusters. There is another dataset related to this Google store that includes more numerical variables like Sessions, Average Session Duration, Bounce Rate, Transcations and Goal Conversion Rate.
This was not part of the original Kaggle competition but it came to be as a result of a “leak” in the competition dataset which sparked some discussion in their forum after which the competition was shut down. https://www.kaggle.com/c/ga-customer-revenue-prediction/discussion/68235#401950
The data has been provided by a Kaggle user in corresponding csv files here https://www.kaggle.com/datasets/satian/exported-google-analytics-data?select=Train_external_data_2.csv
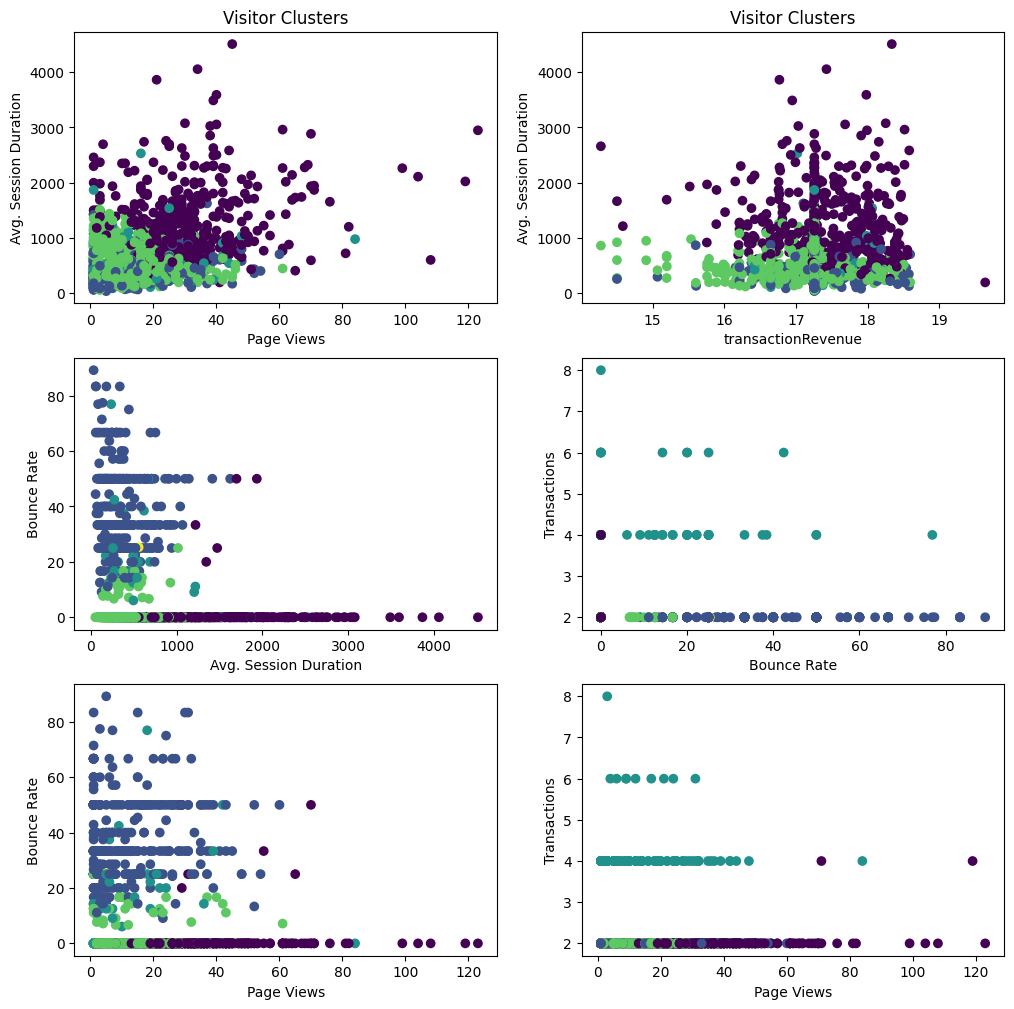
Based on the results of this clustering, we could say there are 3 clear clusters, dark purple, green and dark blue
-
(Green): Low pageviews, low session duration, low BounceRate, few transactions
-
(Dark blue): Low session duration, few transactions, low to medium pageviews
-
(Purple): Low to medium page views, low bounce rate, medium to high transaction revenue, generally high session duration
NOTE: Replacing the NaN values of Avg. Session Duration with 0 may not make sense. For example, some of these visits with NaN durations have high transactionRevenue and PageViews. So a simpler option is to remove these NaN rows altogether first.
Now we include the categorical variables as well, and see what the clusters look like.
Including Categorical Variables
We includes the numerical variables we previously selected, and new categorical variables. But we don’t want to select all categorical variables as some may have too many categories, like cities or metros.
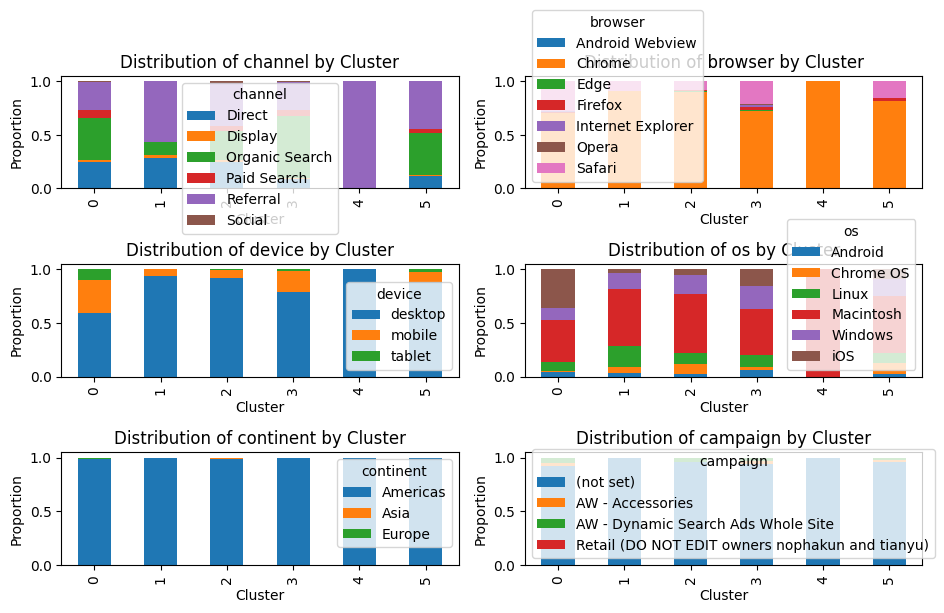
Visualising the distribution of categorical variables in each cluster
-
Cluster 4 seems to be exclusively Mac users who click on external links to the Google Store, on Chrome browsers in their desktops
-
Cluster 0 has the most mobile visitors, Safari users and on an iPhone
-
Cluster 3 has the most Android phone visitors, the most organic search visitors and also the most Windows users
-
Cluster 1 has the most Linux users, Direct visits, some mobile users and some Safari users.
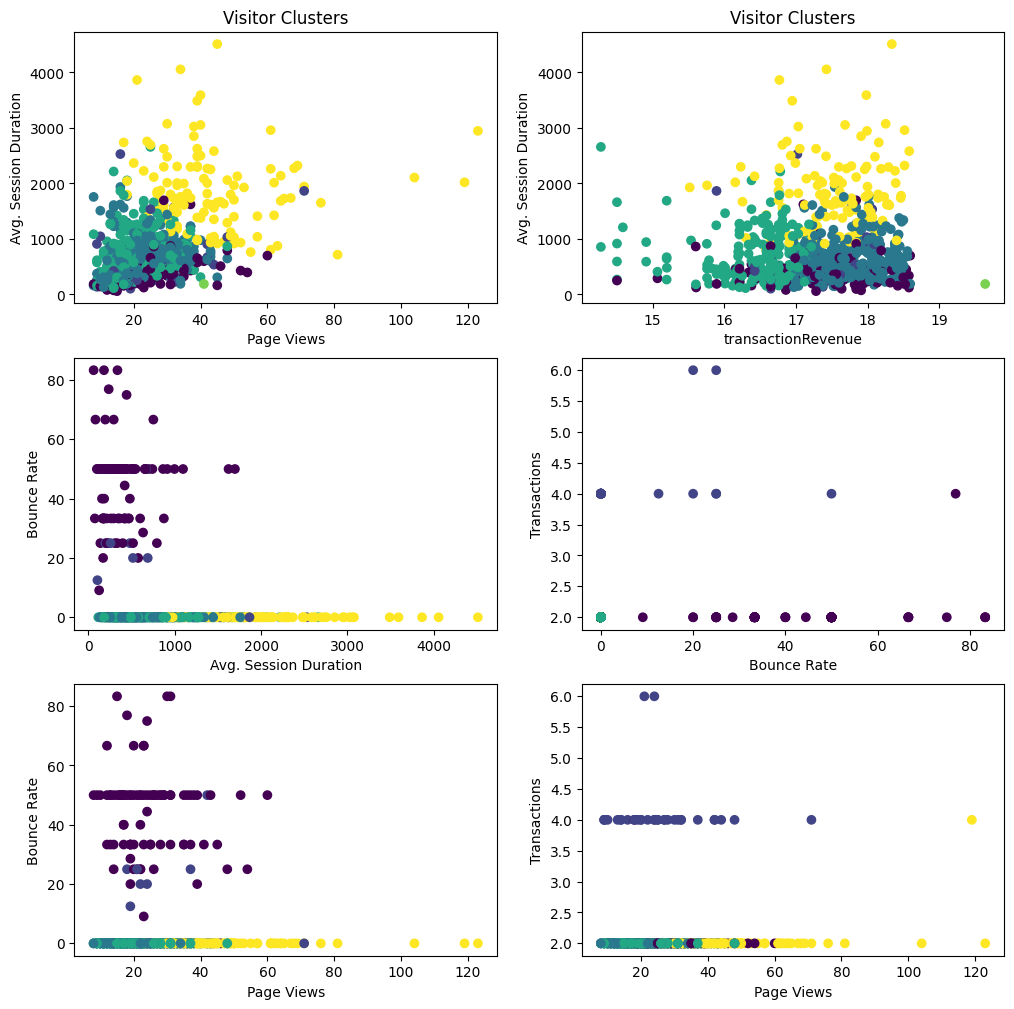
Numerical variables in each cluster
-
(Green): Low pageviews, lower Avg. Session Duration, low Bounce rate low-medium transactionRevenue
-
(Yellow): Medium pageviews, Avg.Session Duration, medium-high transaction revenue, low bounce rate
-
(Purple): Low pageviews and session duration, medium to high transactionRevenue and high bounce rate
-
(Dark green): Not very clear, coincides with others in these 2 dimensional visualisations
Results
Based on this final clustering, it is possible to separate the website visitors into clusters based on the collection of avaiable features – both categorical and numerical – that are typical of their behaviors. For example, the 4 main clusters that could be of use to a marketing team could be:
- Cluster 1 : Visitors are Mac users who arrive at the Google Store from external links to the Google Store, on Chrome browsers in their desktops AND view only a few pages, don’t spend much time on them but spend a moderate amount of money
So an appropriate strategy for this cluster could be phrased as: “Let’s create content and product info that is Apple compatible, that can be shared by other websites, and not have each page be too long”
- Cluster 2 : Most mobile visitors are from this, they use Safari on an iPhone, view a moderate number of pages and spend some decent amount of time on the session and also spend a decent amount of money.
For which, a strategy could be: “Let’s mobile-optimize most of our content, focus on products that are also Apple-compatible, spread across a few pages and with enough detail to help them make the purchase”
- Cluster 3 : Most Android phone users on a Windows OS are from here, but they tend to search on Google and click links to land on the Google Store, view only a few pages and spend little time but spend a lot of money.
Where the strategy could be phrased as: “Let’s also focus on Android and non-Mac users, create SEO optimized content but not too many pages of them”
- Cluster 4 : Has the most Linux users, Direct visits, some mobile users and some Safari users but all other behaviour remains similar to cluster 1.
For which the approach could be: “Maybe it is also worth appealing to Linux users, especially those who return a lot, on mobile”
Conclusion
This analysis shows an approach to website audience clustering that marketers can adopt. It uses unsupervised machine learning in the form of the kMeans clustering algorithm.
Roughly speaking, the idea is to give marketers a data-driven method to categorize their website audience into different groups, while taking into account all the available features of their visits at the same time, instead of one or two.
It is important to note that the clustering approach can also be subjective to a certain extent, so marketing teams can choose a clustering that best fits their needs. For example, the very choice of the number of clusters is something that needs to be arrived at based on an educated guess, experience with real world interactions with customers or industry best practices.
This analysis can also be improved further by ingesting additional data from other sources. For example, since the above clustering is still purel based on web analytics data, it can be combined with CRM data or other sales data acquired through sales teams, surveys or feedback forms. This will mean more accurate sets of variables that closely capture audience and buyer characteristics. This will allow marketers for example, to do more targeted ad campaigns for high spending customers.
One practical way in which this kind of clustering can be operationalized in the real world is through a user-friendly dashboard that automatically creates various segments of customer IDs in the CRM database based on the customer and purchase information and also all the web analytics data to give marketing teams and sales teams:
-
a choice or sequence of stages in which to approach potential shoppers close to conversion
-
clusters of website visitors who are showing interesting content based behaviour but may not be purchasing, which can be used to create content to make them purchase
-
clusters of website visitors who show patterns of leaving or ending their purchase patterns, who can be nudged to continue purchasing
-
automatic assignment of a new website visitor into a specific cluster (say one of high spending repeat visitors) based on their initial digital behavior.