What my RunKeeper data says about my cardio habits
I analysed my RunKeeper data for free to see trends in distance, calories burned and more
This is a simple idea for a sideproject that came to me as I was thinking about my daily routine and how it has changed over the years.
I had ignored my health for a long time in my late twenties and early thirties. But then during the COVID lockdowns and the years following it, I managed to get a decent healthy routine going, where I would get out and walk/run as often as I could. I have a preference for doing this kind of thing at the end of a day, after work. And although I couldn’t do it every day due to work commitments and feeling exhausted, I told myself I would try and get some steps in every few days - at least something.
There are phases when I get on a decent streak. But at other times, and days when I felt like I was being lazy, I wanted to try and recall how I felt during the good streaks, how and when I got my runs in, hoping to get inspired again.
Most people do this kind of analysis easily with their smart watches, FitBit, fitness tracker, heart rate monitor or other wearable device automatically tracking data and showing reports in real-time. Unfortunately, I don’t use any of those dedicated devices. But I do take my old phone, without a SIM card, start the RunKeeper app and listen to podcasts which I have downloaded beforehand. I thought I could try and analyse the data from RunKeeper to see how I have been doing.
What I used
- Python in Visual Studio for extraction and analysis
- Standard data analysis packages - pandas, numpy
- Packages for visualisation - matplotlib, seaborn, plotly
- The pvlib library for solar position calculations
Data collection
Not as straightforward as I had expected. The first problem was that there was no automatic way to extract the data from RunKeeper.
- There is an Insights feature in the mobile app but it is not available in the free version and you have to pay for an upgrade.
- The web interface is quite clunky and although there is a Reports dashboard showing distances covered per month, seeing more granular data and downloading anything requires a pro subscription again.
- Managed to go Settings and find an “Export Data” option. Even this didn’t work at first but I tried after a few weeks and then I was able to download a zip file.
Finally! This had what I needed. There is a csv file listing all my recorded cardio activities and also other files for heart rate, measurements and such which I hadn’t recorded regularly. I read the cardio csv file into a dataframe.

The cardio dataframe has 361 rows and 9 columns. The main variables of note are:
- Activity Id : A unique identifier for each activity.
- Date : Date and time of the activity in date-time format.
- Distance (km) : Distance covered during the activity, in km.
- Duration : Duration of the activity in hours, minutes, seconds.
- Average Pace : Pace of the activity, in minutes per km.
- Average Speed (km/h) : Average speed in km/hr.
- Calories Burned : No. of calories burned during the activity. I wouldn’t take this as precise but it’s a rough estimate.
- Climb (m) : Total climb during the activity, in meters.
Exploration
First, setting the Date variable to index and checking how the distance covered has changed over time.
Distance

- There was a huge gap between late 2019 and late 2020 (in part due to the pandemic lockdowns). And when I started, I started slow.
- The distances were usually tied to set routes that I would take depending on where I lived (in Singapore) and what was a scenic walk aroudn that area.
- For most of 2021 I was living in one place and I must have tried a few different routes then. You can see a big jump in distance when I found a long route that was scenic (around the Singapore River along the Waterfront/Promenade area).
- In late 2021 I moved to another apartment and stuck to a steady route of just under 8 km until August 2022.
- And then there was a gap again when I moved to Bremen in Germany and I only picked back up towards October after settling in.
- For the whole of 2023 I stuck to one standard route of around 7 km near my apartment, along the edge of Burger Park, the big park in the centre of Bremen.
- Around late July in 2023 I moved to another apartment and I found another route, which was slightly longer at 8 km, again along a nice scenic area next to the Weser river in Bremen.
- The scattered points of smaller distances in between the “steady” phases (early 2022 and 2023, 2024) might have been instances of the RunKeeper app not syncing properly, not detecting start and/or stops due to lack of wifi/4G data or just me stopping early due to getting tired or injured.
Duration
Next up_ Duration. This might be highly correlated with distance because I generally follow the same pace - walking for around 2 minutes followed by jogging/sprinting for 1 minute or so, on average. The variable is in hours:minutes:seconds format, and some entries were under 1 hour, so it needs to be converted into seconds for analysis.
def duration_to_seconds(duration):
    parts = list(map(int, duration.split(':')))
    if len(parts) == 2:   # for when it's under an hour
        minutes, seconds = parts
        return minutes * 60 + seconds
    elif len(parts) == 3:  #for when it's an hour or more
        hours, minutes, seconds = parts
        return hours * 3600 + minutes * 60 + seconds


cardio['Duration (seconds)'] = cardio['Duration'].apply(duration_to_seconds)
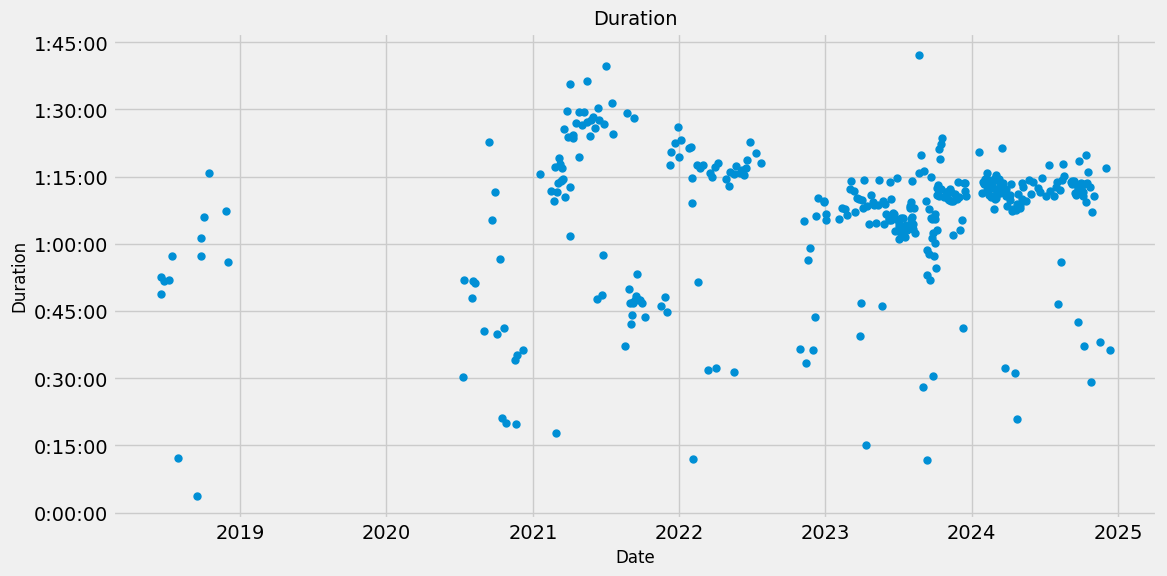
As expected, duration and distance are highly correlated. The longer the distance, the longer the duration. Some variations could be because of incorrect syncing of the RunKeeper app and other issues.
Average pace and speed
Average pace and speed should generally be consistent, give or take variations due to the app measurement. The values for Average pace need to be converted from minutes:seconds to seconds though.
def pace_to_seconds(pace):
    minutes, seconds = map(int, pace.split(':'))
    return minutes * 60 + seconds

cardio['Average Pace (seconds)'] = cardio['Average Pace'].apply(pace_to_seconds)
Also, as it turns out, there were some outliers in the data, with some records showing that I take over an hour for a kilometer! This must have been me accidentally turning the RunKeeper activitiy on or forgetting to stop the timer. I removed these outliers.

That’s more like it. I usually average around 9 to 10 minutes per km (including walks + sprints). And Average speed almost mirrors the pace, as expected. There might have been a slight increase in speed in late 2023 to early 2024, despite the distance being generally the same. This may have been due to me trying to push myself a bit more.
Calories burned
Calories burned also seems to have outliers (some to the order of 8). No way am I burning calories to the order of 8! The duration, pace and distances of the outliers seem normla but calories burned is way off. This has to be an error with the app features. I remove these outliers obviously.
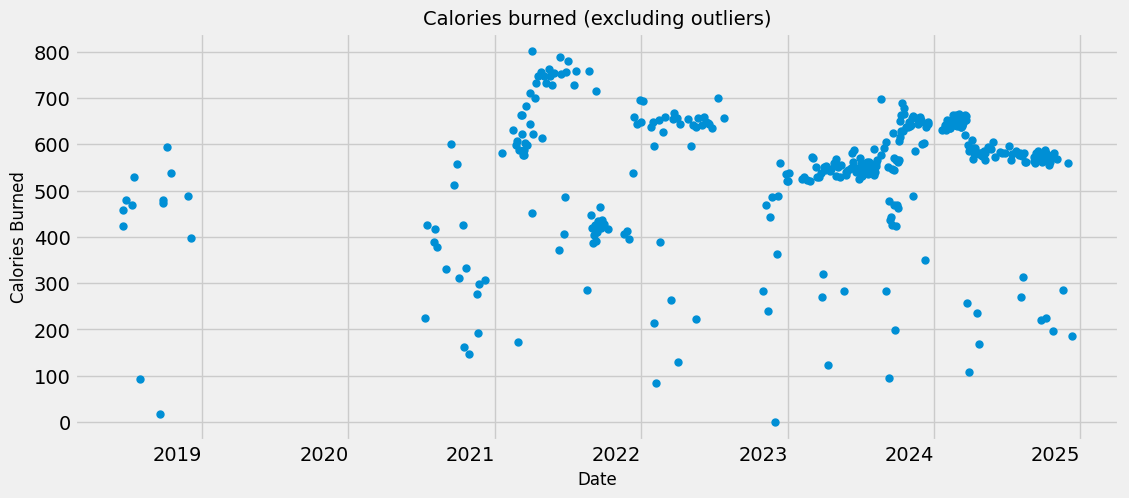
That makes sense. Fairly simple correlation between distance run and calories burned. The app does not track calories through heart rate or other biometric data, so it’s a rough estimate based on distance and pace. So this makes sense.
As expected, I see a slight jump in calories burned in late 2023 and early 2024, despite the Distance and Duration being approximately the same in this period. This dropped back down around mid 2024 to a normal level. This again confirms my intuition that this was due to a slight increase in speed (which can also be seen in the slight drop in the Average Pace graph and increase in the Average Speed graph), as I remember exerting myself a little more during that period, with faster sprints.
This is good insight - helps me try and push myself a little more, knowing I can do it since I know I have done it before.
Climb
Not sure what I can glean from change in the climb over time. I have usually taken flat routes (with some stairs, overhead bridges across roads etc. sometimes) don’t think I have changed my routes much. I will look at the data to see if there is any pattern.
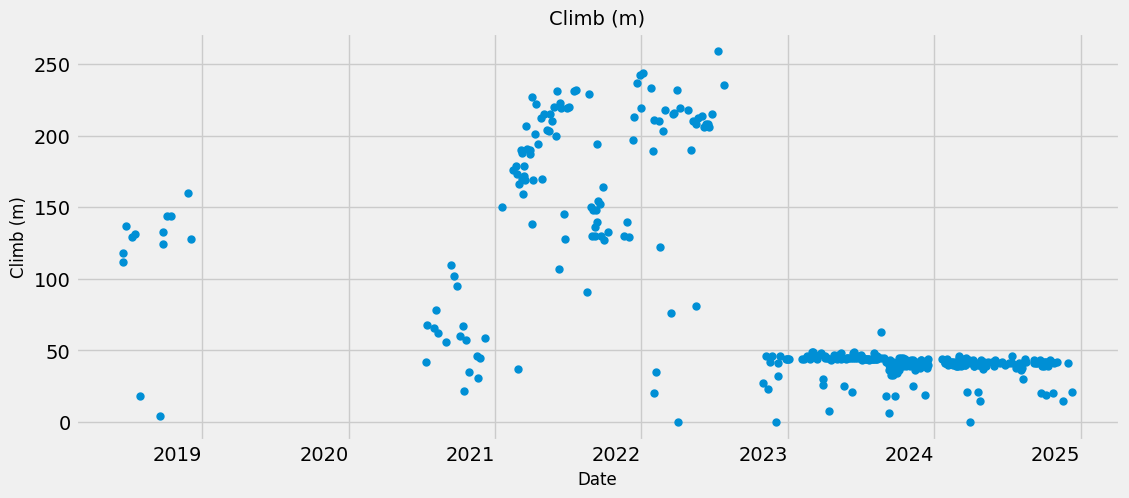
Hmmm, this is interesting. The routes after I moved to Bremen have been flat. The routes in Singapore (pre-2022 August) have had some climb. I realise that there were no stairs or overhead bridges that I traversed in Bremen, whereas those were quite common in Singapore.
Activity start time
Lastly, I was also curious about the times during the day that I start a run. Sometimes this is helpful when I feel lazy close to sunset and think that it is too late, but in reality I may have started a run at that time before.
RunKeeper records the time at which I press the start timer. I remember getting the workouts in Singapore after sunset, sometimes even well into the night, because of the cooler weather. When I moved to Bremen I continued this habit for a while, even during winter when it got really cold. But slowly I started running earlier, before the sunset to catch as much light as I could outside.
For this, I had to extract the hour from the Date variable, convert it to seconds and then plot it against the Date.
cardio['Time'] = cardio.index.time
cardio['Time_seconds'] = cardio['Time'].apply(lambda x: x.hour * 3600 + x.minute * 60 + x.second)
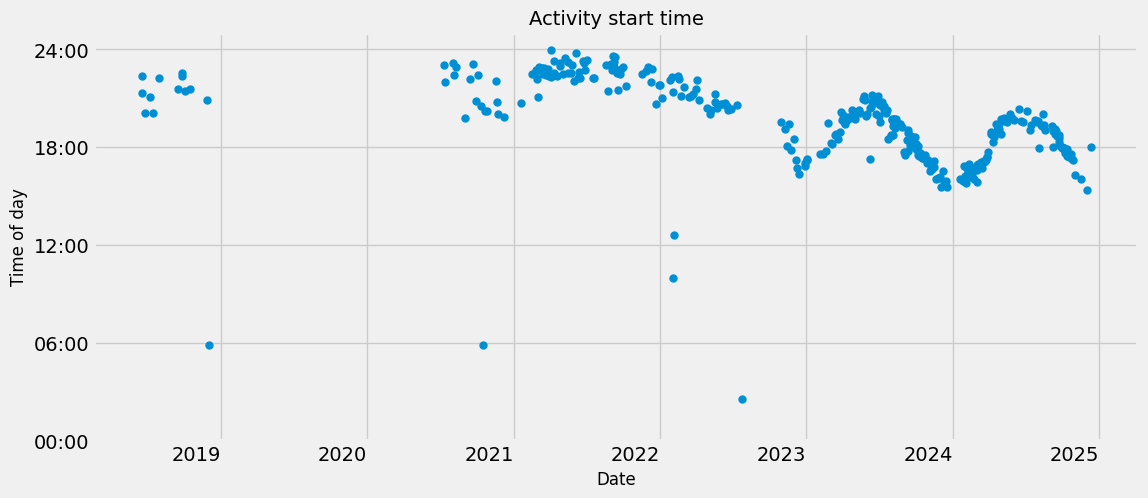
As expected, the workouts were usually in the evening before late 2022, after it got dark. Some were even well into the night, close to 10 pm. Looking back at it now, I can’t believe I was out that late!
But after moving to Bremen, I started running earlier, before the sunset, to catch as much light as I could outside. This also meant that I would change my start time to match the changing sunset times throughout the seasons in the year, usually around 1 hour or so before the sunset. This can be seen in the wave like pattern in the graph post 2023.
Comparison of activity time with sunset time
Just to visualise this, I also wanted to overlay this graph with the sunset times - in Singapore for pre-2022 August and in Bremen for post-2022 August. Getting the sunset times was not as easy as I thought. After some research, I found a Python package called pvlib which can retrieve the sunset times from the past for specific latitude and longitude coordinates.
Since the sunset times for Singapore and Bremen are obviously different, I got the sunset times in Singapore for dates from 2018-06-01 to 2022-08-01 and in Bremen for dates from 2022-08-01 to 2024-12-31.
sg_lat =  1.35
sg_long = 103.82
sg_timezone = "Singapore"
sg_dates = pd.date_range(start="2018-06-01 ", end="2022-08-01", freq="D", tz=sg_timezone)
sg = pvlib.location.Location(sg_lat, sg_long, tz=sg_timezone)
sg_sun_times = sg.get_sun_rise_set_transit(sg_dates)

br_lat =  53.07
br_long = 8.80
br_timezone = "Europe/Berlin"
br_dates = pd.date_range(start="2022-08-01", end="2024-12-31", freq="D", tz=br_timezone)
br = pvlib.location.Location(br_lat, br_long, tz=br_timezone)
br_sun_times = br.get_sun_rise_set_transit(br_dates)
Both these returned a dataframe with sunrise, sunset and transit times for each day in YYYY-MM-DD HH:MM:SS format. I just had to get the sunset times from these, extract the date and time from each row, convert the time to seconds for calculation and merge the dataframe for each location with the cardio dataframe. That automatically extracted the cardio data corresponding dates for each location.
For example:
sg_sunset_df = pd.DataFrame({
    "Date": sg_sun_times['sunset'].dt.date,
    "Sunset_Time": sg_sun_times['sunset'].dt.time
})

sg_sunset_df['Sunset_Time_Seconds'] = sg_sunset_df['Sunset_Time'].apply(lambda x: x.hour * 3600 + x.minute * 60 + x.second)
sg_sunset_df.set_index('Date', inplace=True)
cardio['Date'] = cardio.index.date  # Extract the date component from the index of df2
cardio.set_index('Date', inplace=True)
sg_merged_df = cardio.merge(sg_sunset_df, left_index=True, right_index=True)
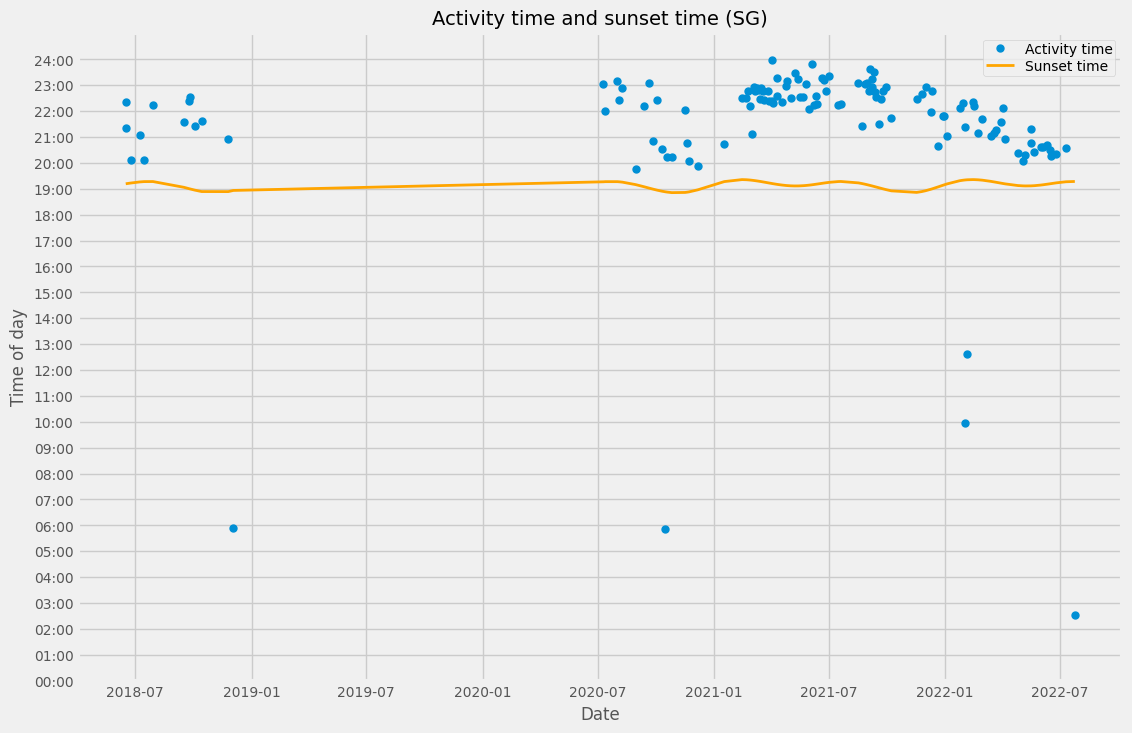
As mentioned earlier, the workouts in Singapore were usually in the evening well after the sun had gone down, and some even late into the night. This also speaks to how safe Singapore is, and also how well-lit and well-maintained the main roads are throughout the island.
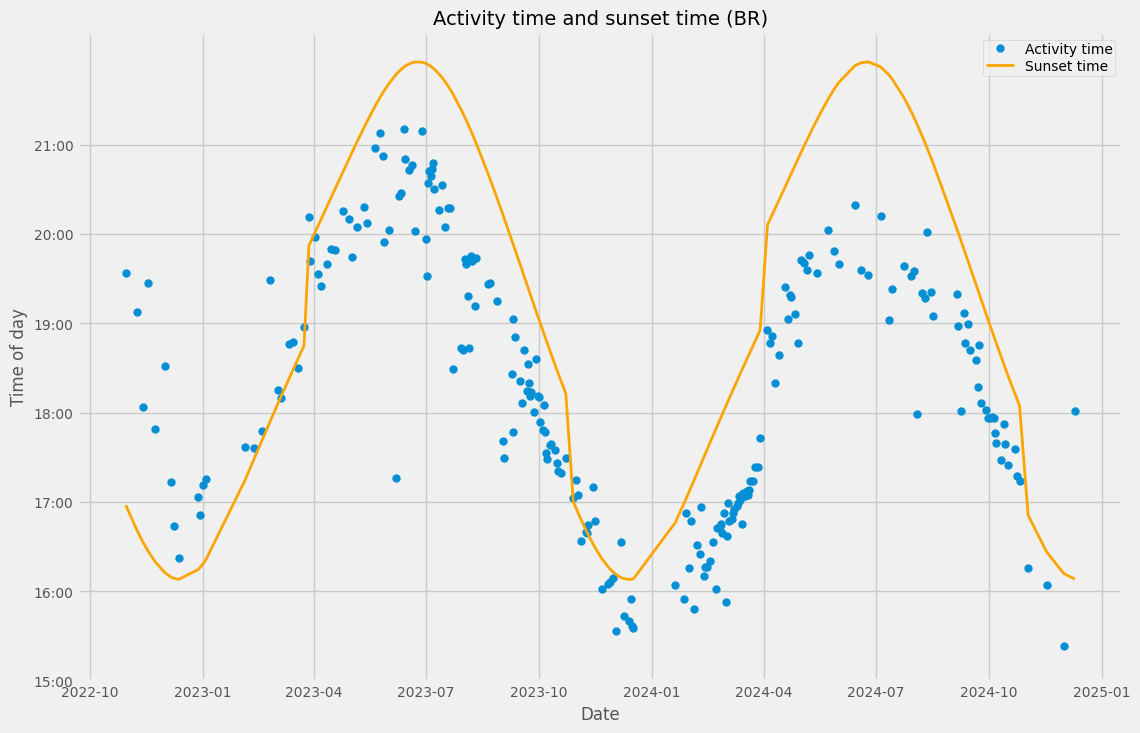
In Bremen, I initially started getting out after sunset, as that was what I was used to. Then I started running earlier, partly because it was cold and dark in the winter period, and partly because I wanted to catch as much light as I could outside. Soon I started following the seasonal pattern of sunset times, almost mirroring it exactly and only very rarley did I start after the sun had gone down.
One more point - I can also clearly see how I adjusted my workout start times to the Daylight savings, when the clocks went forward an hour in March and back in October. I started running an hour later from late March and an hour earlier from October onwards to catch the light before the sunset.
A bit of fancy visualisation to add: I wanted to also see how I run “past the sunset”, i.e. I might start before the sun went down but by the time I had returned, it would have been past the sunset (although it was still light outside - the “twilight” period). So I added a vertical line starting at each Activity start time, proportional to the Duration of that corresponding activity, to show how I crossed the sunset time.
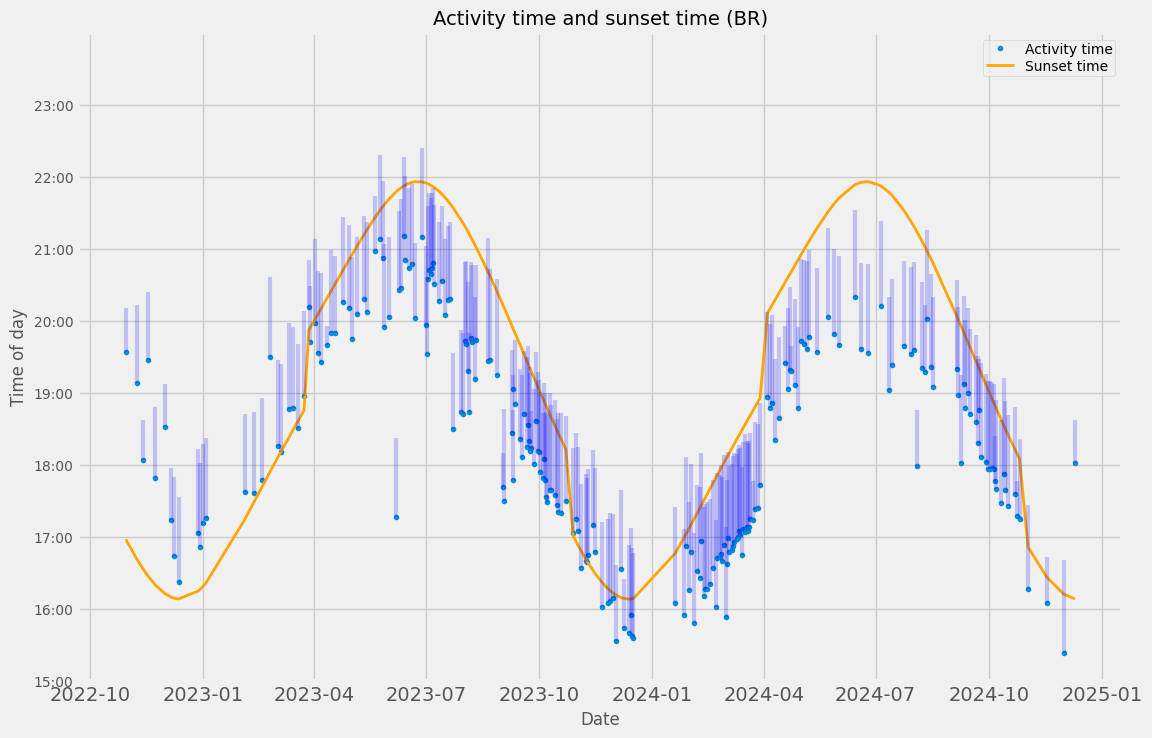
That looks nice. So I did finish after the sunset time for the most part of the winter but in the summer of 2024 I began to prefer getting to be outside more when the sun was out so rarely did I cross the sunset time then.