Discovering waste price determinants
Finding correlations between the price of waste and various potential price determinants.
This was a project that I worked on for a market-leading energy trading firm in Germany. The firm wanted to identify correlations and patterns between waste prices and potential price determinants such as weather, energy, and business cycle factors, and wanted me to recommend which were the best ones to consider for future prediction and modeling work.
Tech used
- Python in Visual Studio
- Standard data wrangling, exploring and visualization packages: Pandas, NumPy, Matplotlib, Seaborn
- Time series analysis
The wPreis Dataset
The dataset was provided to us by the firm. It contained the price of waste as recorded by an anonymous waste recycling company in Bremen from Sep 2020 until Sep 2023. The prices corresponded to the amounts that the company paid sellers for collecting waste from them (positive values), or which the company was paid for collecting waste (negative values).
There were also 10 unique clusters or collection of Postleitzahl (postal code in Germany) and had 4 unique product categories – ‘A2 - geschreddert’, ‘A1 & A2 - geschreddert’, ‘A2 & A3 - geschreddert’, ‘A3 - geschreddert’. There were no null values.

The wPreis for all 3 categories in the same cluster are somewhat correlated, with occasional deviations. This is observed in all clusters more or less. For some clusters, there is only one waste category, *A1 & A2* for [1, 4, 6, 7, 8, 9].
Exploring Potential Price Determinants
We explored a few different variables to see how they correlated with the wPreis values.
1. Weather
First Approach: Using data extracted from an open meteo free API. Parameters include temperature at 2 meters, wind speed at 10 meters, precipitation, rain, and snowfall.Accessed using latitude and longitude of cities in each cluster.
Second Approach: Data obtained from Deutscher Wetterdienst (DWD) – the German Meteorological Service – they provide weather data dating back to the 1830s Parameters include temperature mean and max.

The coefficients of wPreis with all other weather variables are too small. Hence this may not be a good determinant.
For the Cluster [‘40’, ‘41’, ‘42’, ‘44’, ‘45’, ‘46’, ‘47’], Correlation between wPreis and windspeed: 0.06 and Correlation between wPreis and temperature: 0.03
2. Energy
For energy, we looked at 3 variables – oil, electricity and gas prices.
Electricity
We used data from netztransparenz.de (ct/kWh) which contains electricity prices for the whole of Germany from Jan 2021. This was the best choice we could find on electricity prices.
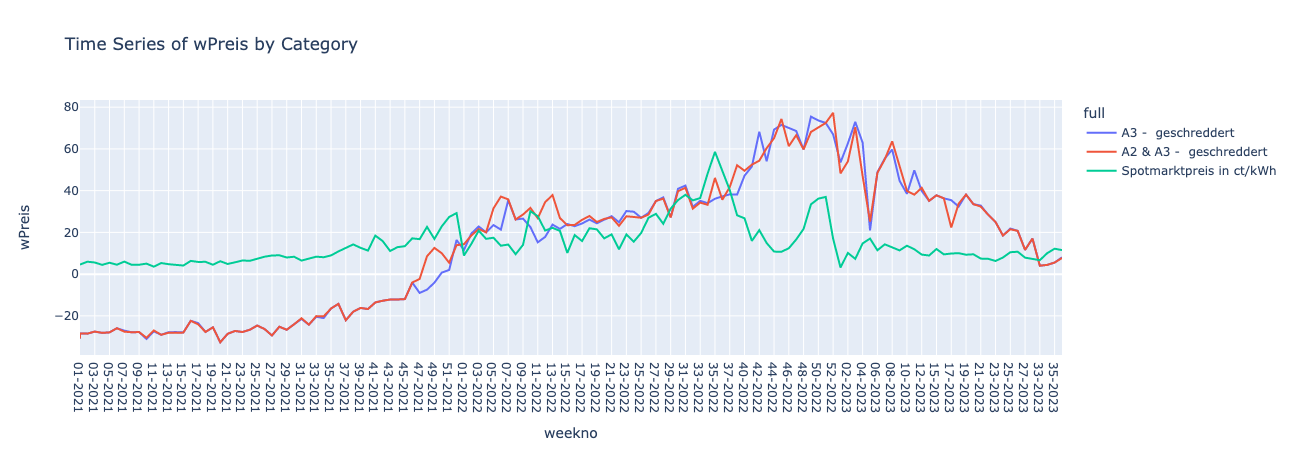
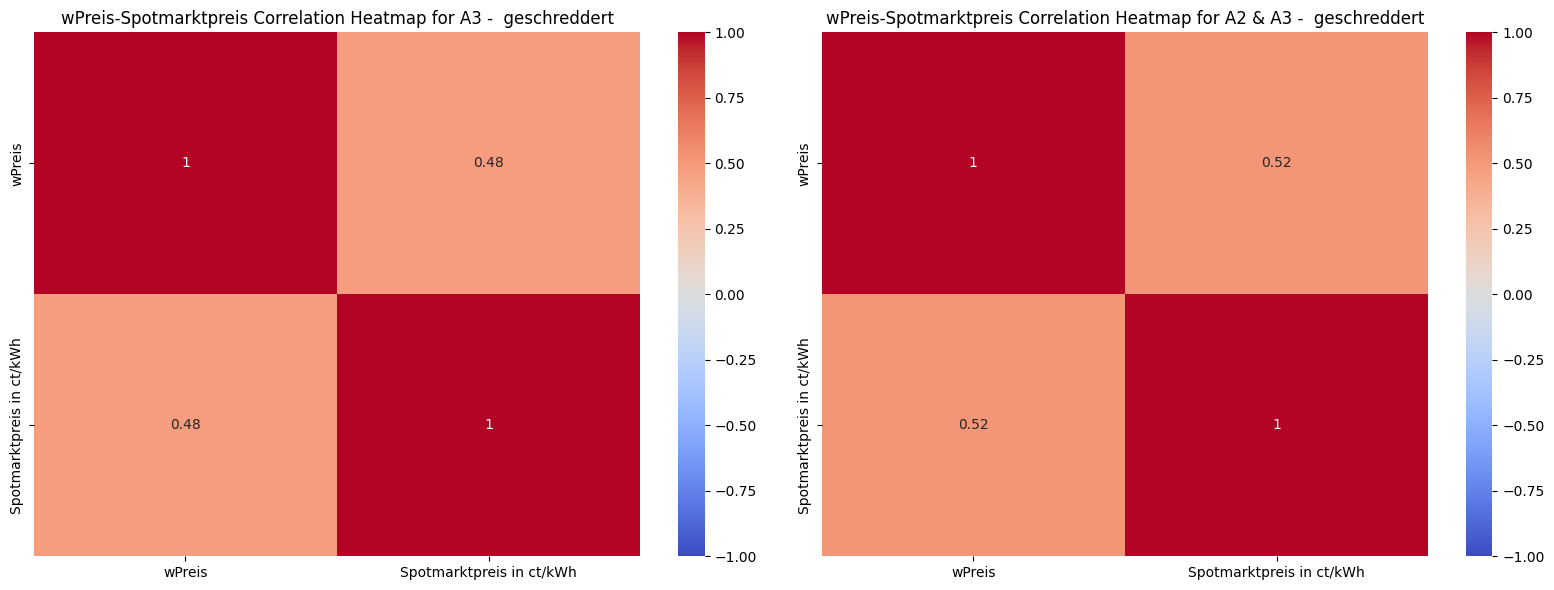
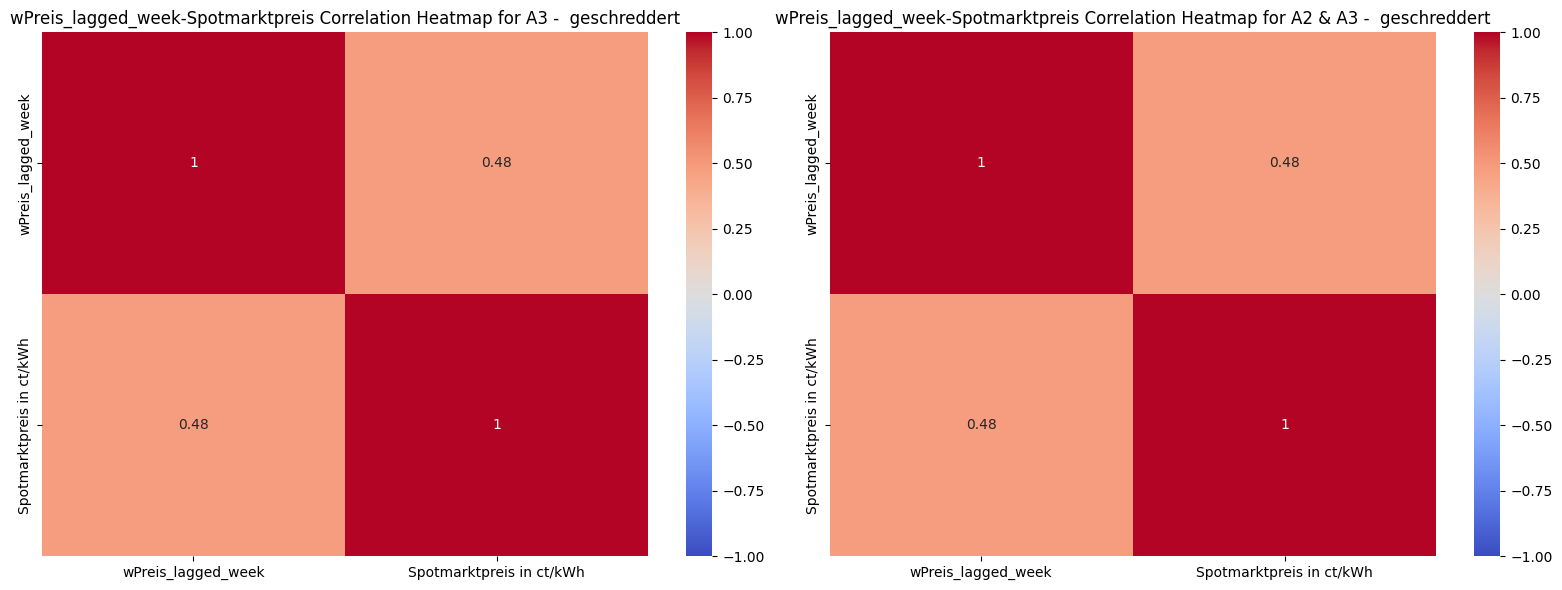
Although visually it looks like there was some correlation in some parts, the coefficients are not signfiicant. A2 & A3 category alone has 0.52 though.
Oil
For oil, there was no data available on prices per region in Germany (this may not make sense either). So we looked at Global Oil Market Prices as a proxy from Yahoo finance, and assumed that relative changes in global prices would have a proportional impact on the same prices in Germany. We specifically tracked the variable Adjusted Close Price (Adj Close) which accounts for events such as stock splits and dividend payments.
We found that there was a close correlation from Sep 2020 to around Jan 2022 for both categories. For A3 - geschreddert, corr. roughly continues until Jun 2022, then inverse corr. until Dec 2022 and then low corr. until Sep 2023. For A2 & A3 - geschreddert, it continues from Jan 2022 to around Mar 2022, then inverse corr. until Dec 2022, and similar to the other category, loses the correlation after that.

Correlation coefficients also validate this, with 0.6 for A3 - geschreddert category and 0.62 for A2 & A3 - geschreddert which are above 0.5 and hence significant.
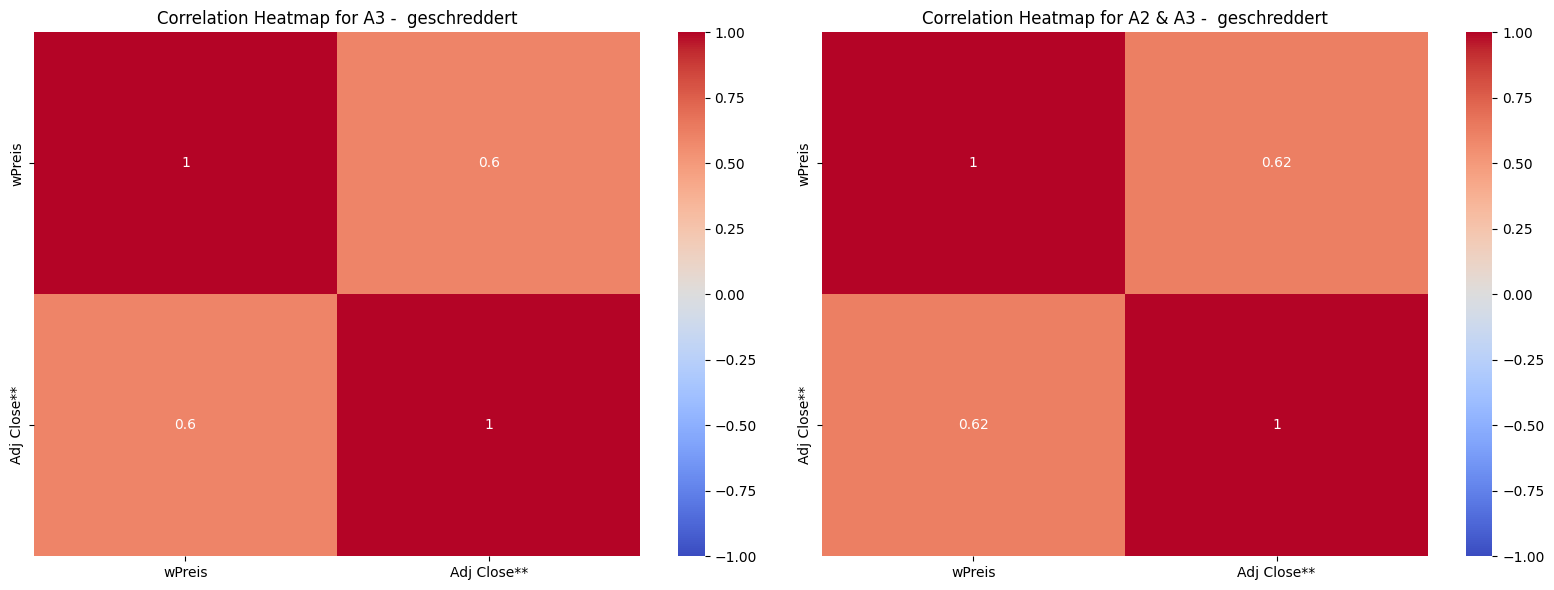
Something remained consistent until Jan 2022. After that things began going in the opposite direction. And from Dec 2022 onwards they become less correlated.
Gas
Similar to oil, we used data the Global Gas prices from Yahoo Finance for the whole of Germany and explored the correlation of wPreis with Adjusted Close Price (Adj Close).

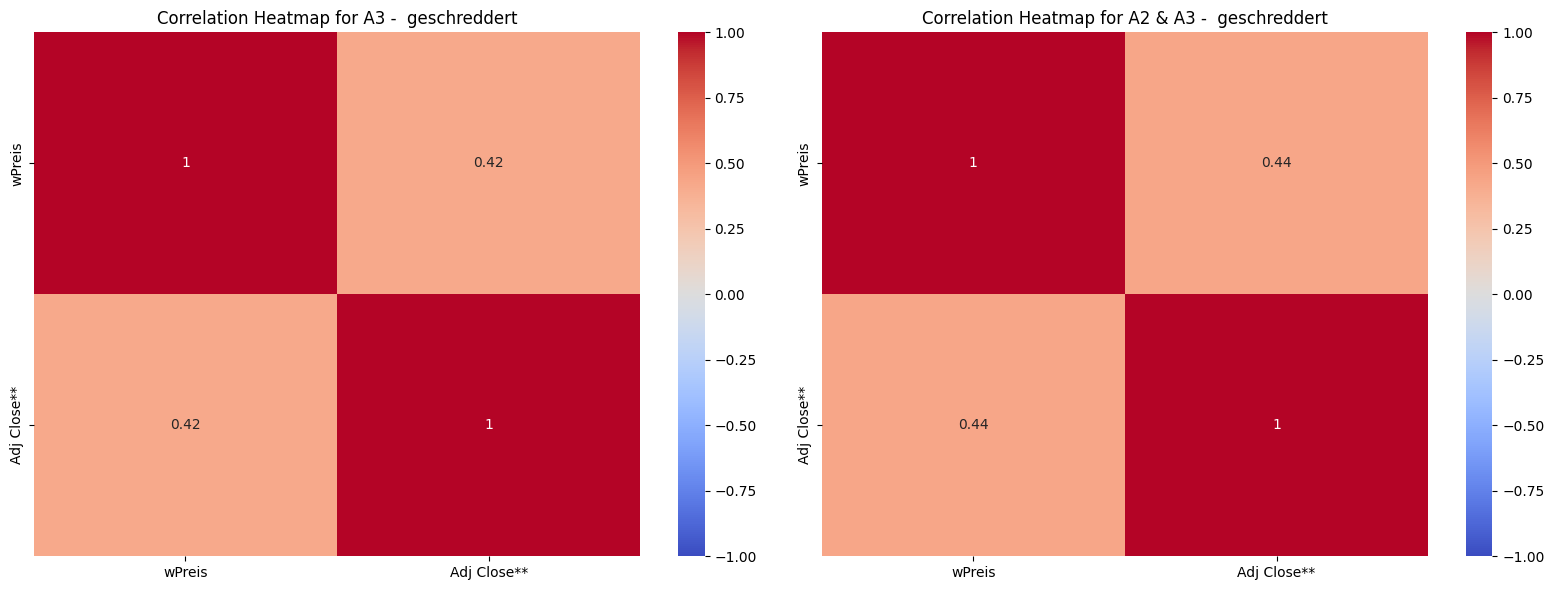
Unlike oil, for gas, the correlation is lower. The best we can say is that the general trend is rising for both from Jan 2021 until around Dec 2022 and after that the wPreis continues to rise while gas prices rise sharply and fall sharply. This is validated by lower coefficients (around 0.4).
3. Business Cycle
For exploring correlation of wPreis with the business cycle we used the DAX - the Deutscher Aktien Index or the GER40 : a stock index that represents 40 of the largest and most liquid German companies that trade on the Frankfurt Exchange. From the dataset, we extract the adjusted close price of the weekly average of the GER40.
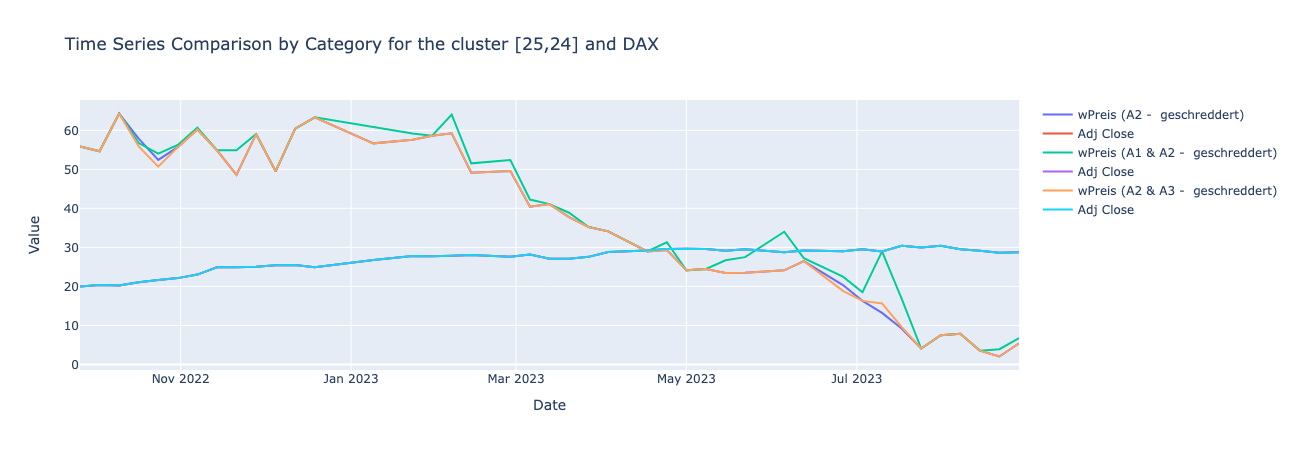
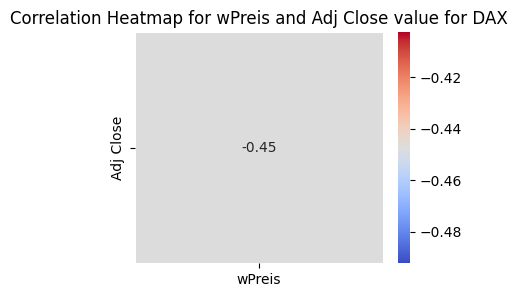
There isn’t any significant difference between the normal wPreis and the lagged wPries, they both range somewhat between -0.45 to -0.63
4. Construction
We also tried to explore whether there was any correlation between construction permits in Germany and the wPreis. Data on construction permits number (per land per month) was taken from Statistik der Baugenehmigungen (code 31111). This variable was taken because it was the only one available with monthly frequency and per land.
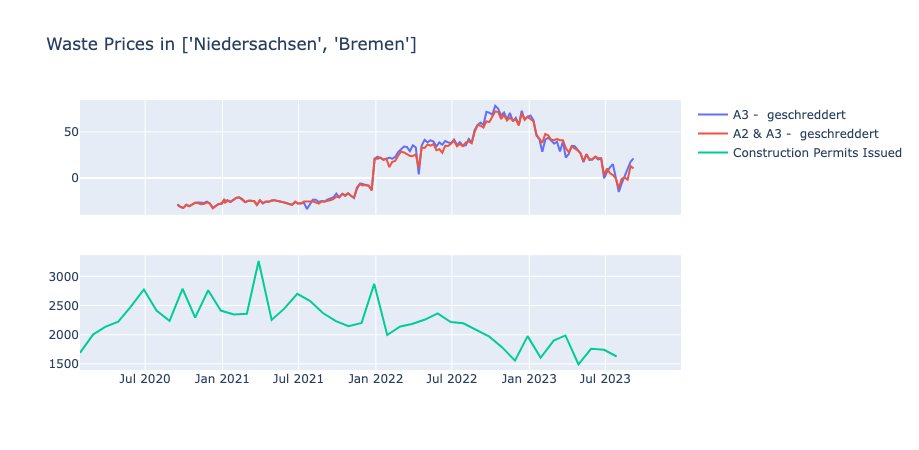
The main insight is that the pattern of correlations is the same. The correlation between actual waste prices and number of permits is large and negative. We assume it has something to do with the waste offer: usually the timespan between getting a construction permit and starting the construction itself is forced to be as short as possible => construction works start as soon as the permit is obtained => the waste is produced immediately => there is more waste offered on the market => the price decreases.
Conclusions
Based on this analysis, we find that
-
Weather determinants show very low correlation with wPreis (which makes sense somewhat) and can be ignored.
-
Energy determinants show different variations with oil showing a somewhat significant correlation of around 0.6 (that too overall including ‘black swan’ events like the Russia-Ukraine situation. Gas shows lesser correlation than oil and so does electricity.
-
Business Cycle (DAX) shows some significant inverse correlation while construction permits show high inverse correlation for some clusters.